Activation Steering in vLLM
Recently I asked one of my friends who does a lot with mech interp what she was using for her activation steering (adding a steering vector to the residual stream of a model to alter its behavior) and she mentioned that she was using bespoke code written with hf transformers. I found it hard to believe that this was the best way, so I did a little digging to see what was out there. Of course I came across TransformerLens, nnsight, and the OG repeng library but I was a bit astounded that none of vLLM, sglang, or llama server had support for it.
That’s why I forked vLLM and added it myself, with support for both global and per-request steering as well as both unified and phase-specific steering for prefill and decode stages. Research code should be made production ready, lest the results of the research never actually affect production workloads! I’m sure the Big Labs have their own optimized inference pipelines that include steering support, but open source should have it too.
I want to talk in this article about how I implemented it and how to use it. If you just want to know how to use it, skip to “API Usage” at the end. My goal in this project was to make researchers able to do their work faster as well as to make it as simple as possible to apply their work in production. To do this, I knew I would need to keep the parts of vLLM that make it fast intact. Namely I needed to not break the CUDA graphs, torch.compile support, the prefix caching, or the continuous batching scheduler. To accomplish not breaking the CUDA graphs or torch.compile support, you have to design around it. No conditionals, every buffer and tensor must be statically sized, and you have to allocate everything before the graph is built.
No conditionals means that you have to do the steering operation every time (at each hook point), and use a vector of zeroes as a no-op in order to not affect any requests that don’t actually need to be steered. This means those requests are a tiny bit slower than they would be otherwise, but they’d be a lot slower if you broke the graph! One tricky thing that this causes is that because you’re allocating a buffer of zeroes, torch.compile will see this and try to pull it out so you need to register the steering as a custom opaque pytorch operation. Making it opaque means that the compiler will leave it alone and you can keep your graph intact.
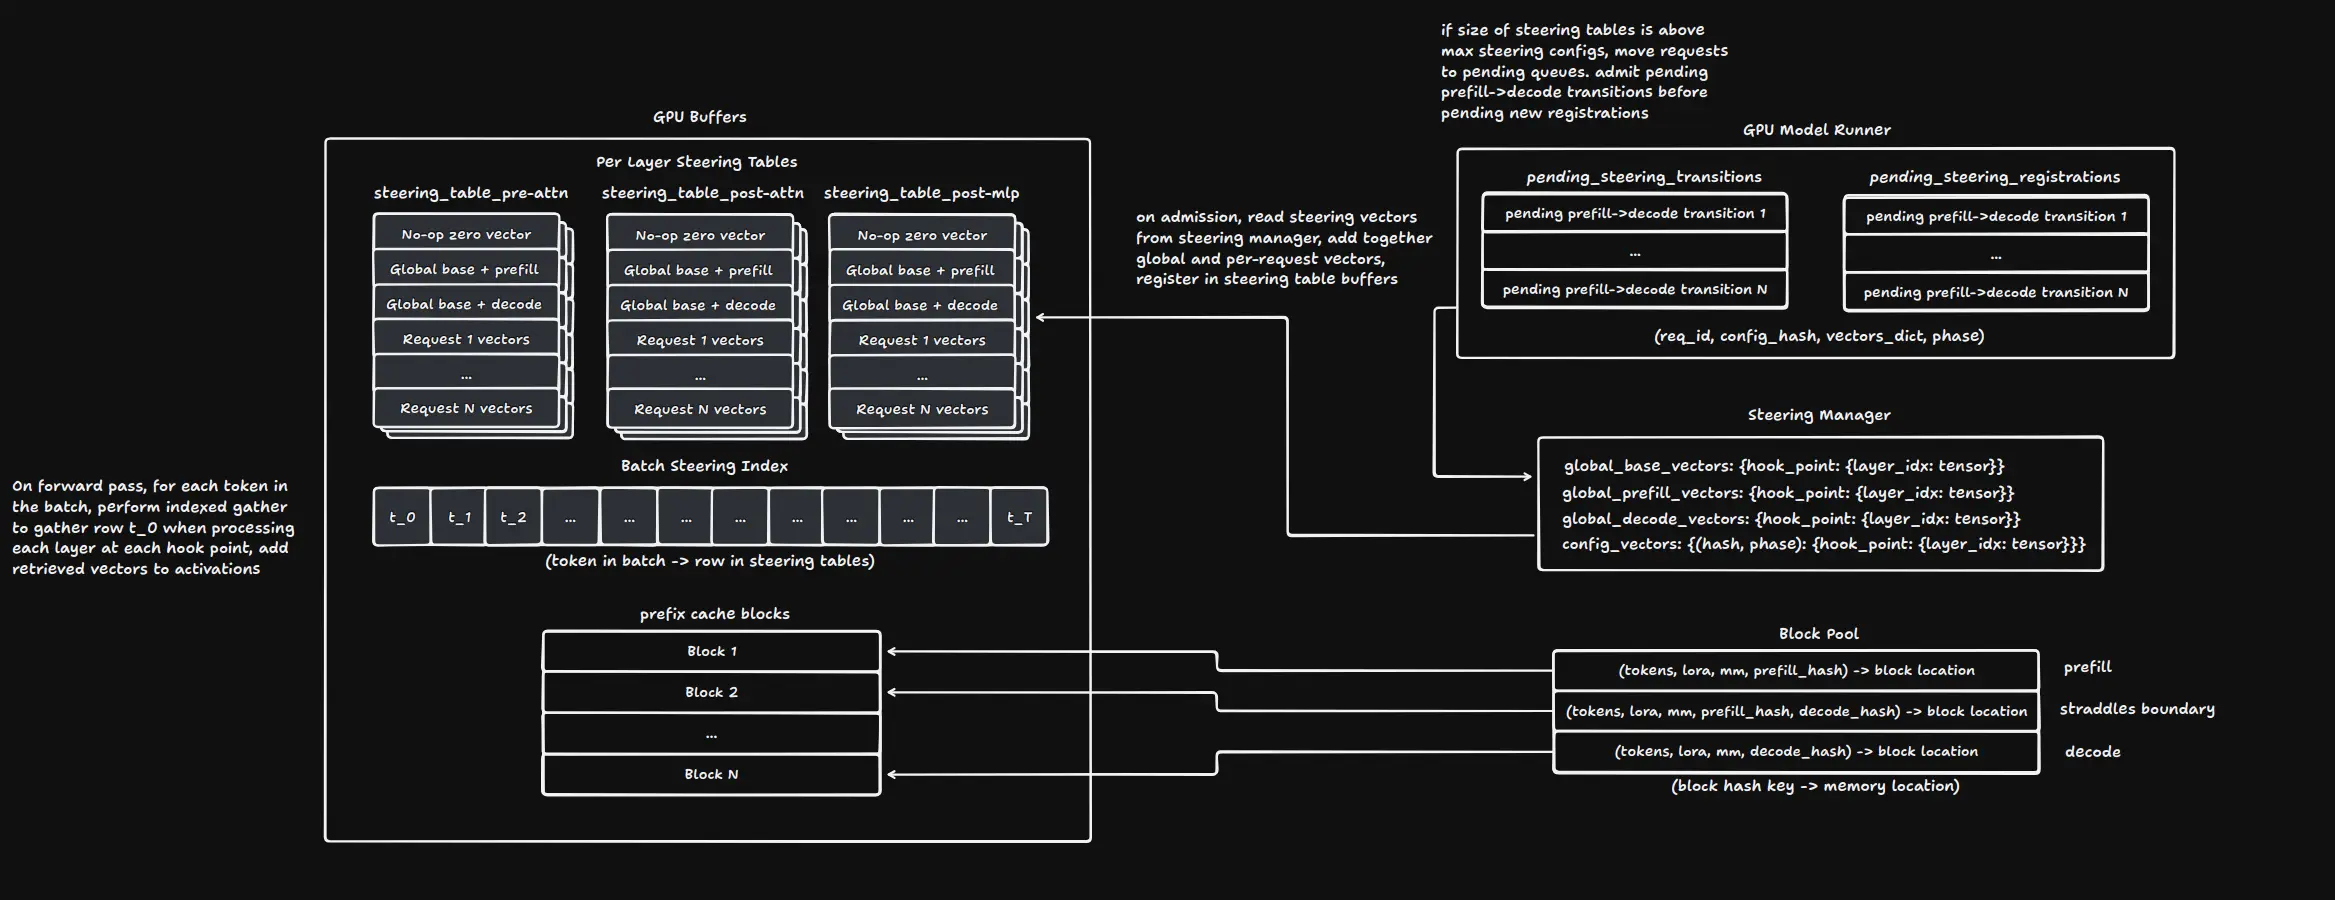
The steering index is what is used to know which config you need to use for each token in your batch. It’s a flat map of token positions in the batch where that position is an integer that points to the row in the steering tables. On a forward pass, you use the value to run an indexed gather and pull that row from the table for the layer and hook point you’re processing and add it to the activations, and do it again for each steerable layer and hook point. This here is what everything else is built to support, the actual adding of the right vector to the activations so you can steer the model.
To allocate fixed size buffers ahead of time, you end up having to set a maximum number of steering configs (these are your steering tables) that you’ll allow to be stored on the GPU and make requests wait if they need a steering config that isn’t in the registry at the moment. This limited space leads to having to make a few decisions about tradeoffs. Before we talk about those though, it’s important to note that you need a separate table for each steerable layer and hook point combination in order to comply with the no conditionals requirement.
Requests with different steering for the prefill and decode phases would take up twice the amount of space, so you can either buffer both steering configs at the same time or you can set up decode steering when the prefill phase is done. This is basically choosing between allowing more independent requests using steering at the same time (twice as many in the worst case) or minimizing latency for the transition between phases. I ended up choosing to allow more independent configs at a time and not have to worry about needing deal with needing different amounts of slots open for different requests, but if latency in the transition is a real problem in production I may change this.
That latency brings me to another thing that the cap on steering configs means you have to deal with, admission control. It’s pretty clear that the first thing you should reach for is a FIFO queue that you put requests into when there isn’t enough space in the table for them. Whenever a request finishes, if no other requests are using its config then you clear that row in the steering table and the scheduler pulls the first request in the queue and puts its config in. This is related to the above issue of latency in the transition from prefill to decode, because you also need to have space in the steering table for that too. If you just add it to the pending registrations queue though, it will end up having to wait through all of the requests in the queue before it can keep going despite having already allocated resources. Due to this, it’s best to make another queue that you use only for pending transitions and have the scheduler check that one and check for new transitions before you pull from pending registrations.
Prefill steering generally requires a bit more careful thinking. You have to change the way the prefix cache works, because the same prefix with two different steering configs applied to it produces different KV entries for each one. This was overall relatively simple for per-request steering because you just have to add the hash of the steering config to the cache key, but there’s a footgun waiting for you when you get to global steering if you allow it to change. When you change the global steering config, you have to invalidate the entire cache and decide what to do with currently running requests. I decided they should be reset, because otherwise you have to store a separate global config and use reference counting to track what should be using the old config vs the new config to know when you can get rid of the old one. The requests that hurt the most from this are chunked prefills that are past the first chunk. I assumed that mid-flight global steering config changes wouldn’t be common and the cases where they are (hot config rollouts during low load, research iteration, etc) are ones where operators can tolerate a short reset cost, so they could eat the performance hit. The complexity of the implementation doesn’t seem worth the potential correctness errors for what should be a relatively rare performance cost on only some requests.
To get a better idea of how it all fits together, refer to the diagram:
Constructing Steering Vectors
In case you don’t know how, you can construct steering vectors to use with this a few different ways. The aforementioned RepEng is the first way I ever did it, you can learn more about that here: [https://github.com/vgel/repeng]. The basic idea is to take the activations at the layer you want to steer from two sets of prompts that have different meanings or feelings, average the activations of each set, and take the difference between the two. Another way is to use sparse autoencoders, which expand the layer into a larger dimension sparse (mostly zeroes) latent space and learn to reconstruct activations from the decoders weights, driven by the feature activations in the latent space. The sparsity constraint tries to minimize overlap between the different features that are “active” for each concept in a prompt. You can make steering vectors from the decoder weights. The work on Golden Gate Claude used feature clamping through a forward pass of the SAE, but decoder direction addition is a commonly used cheaper approximation of this that is easier to implement without breaking the static buffer design.
Once you have your vectors, you can pass them to the API as described in the API Usage section.
Performance
Initial Benchmarks and Profiling
Now for the juicy part, the whole point of this was to see if I could get it running without sacrificing the performance benefits of vLLM so lets dig into performance benchmarks. Note that all of my benchmarks were run on 3090s. Once I get to where I’m happy with these results, I’ll rent an H100 to test on.
Good news first, running with steering enabled but no configs runs with essentially no overhead vs running with steering disabled. Benchmark runs varied from -2% to 2% in either direction which is good evidence that this is just measurement noise and there’s no difference. Also, the memory cost is basically free. It cost 3 x hidden_size * num_layers * dtype_size per config for each hook. Running on Gemma-3-4B (bf16) is about 522 KB per config and ~16 MB for a steering table size of 32. This is less than 0.15% of the VRAM it takes to store the model weights and the kv cache! Even for a 1T parameter model, a steering table size of 64 would only cost ~1.3 GB.
The memory cost being negligible is definitely helpful, because the scheduler has to wait until there is an empty row in the steering table to be able to schedule a request and having distinct configs closer to the max steering size causes a much more pronounced overhead slope. You should use the lesser of your batch size and 4x the amount of distinct steering configs in an average batch.
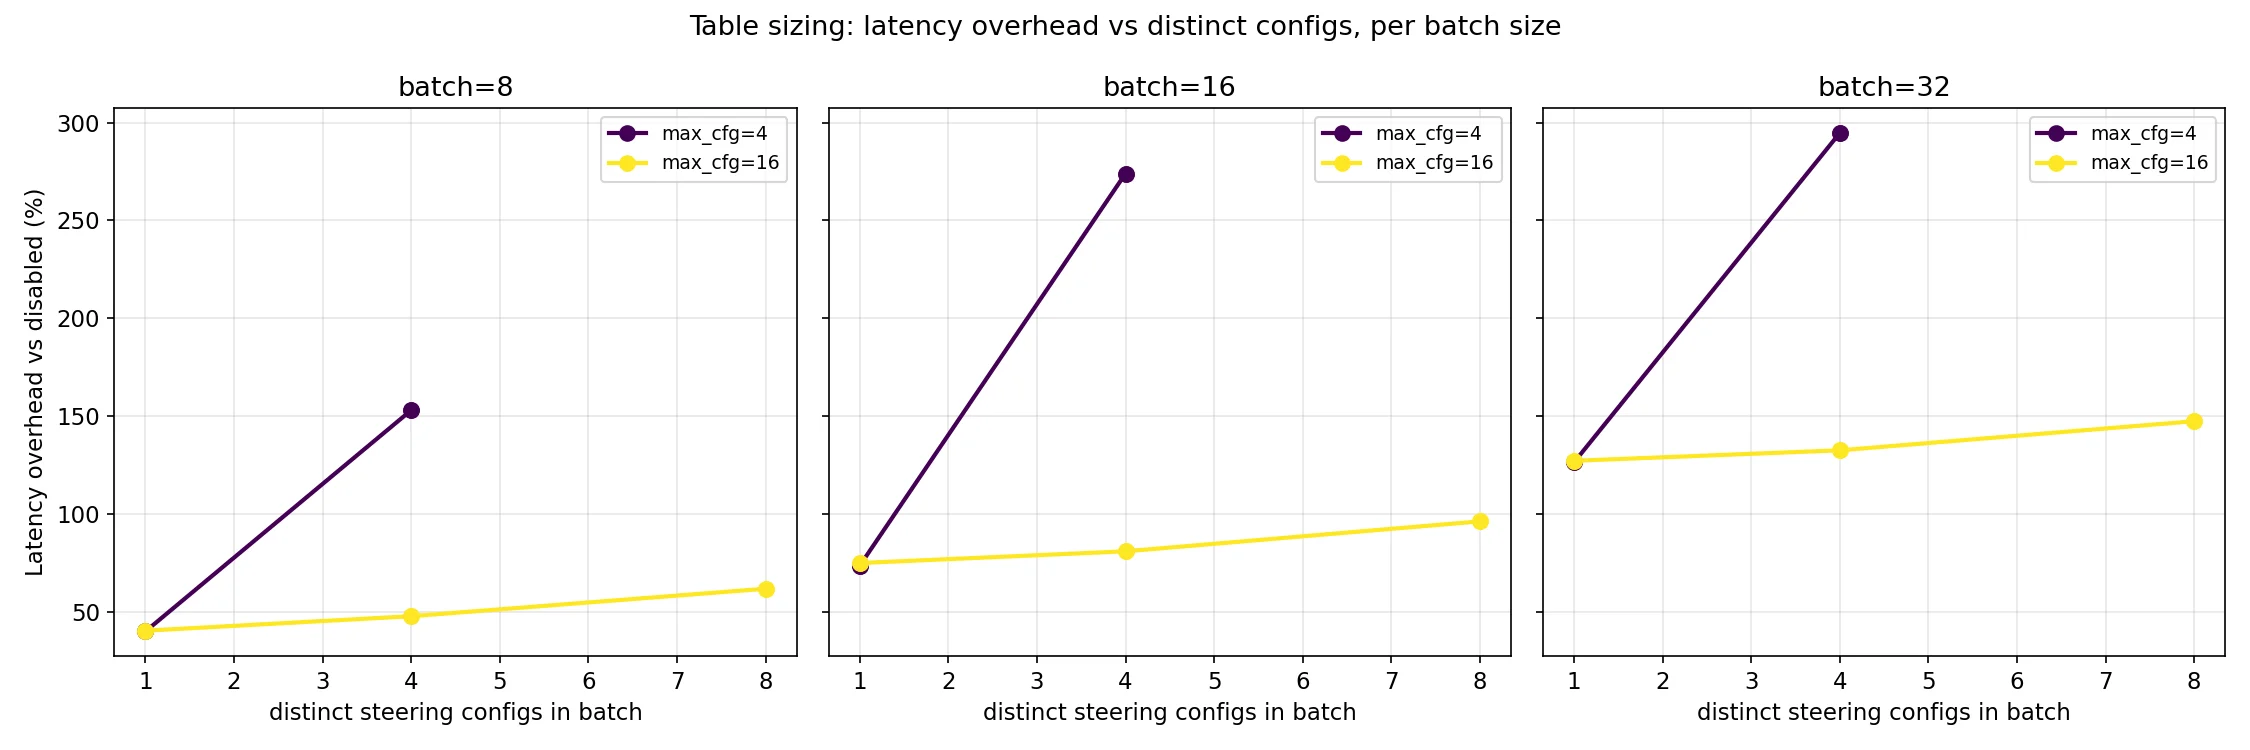
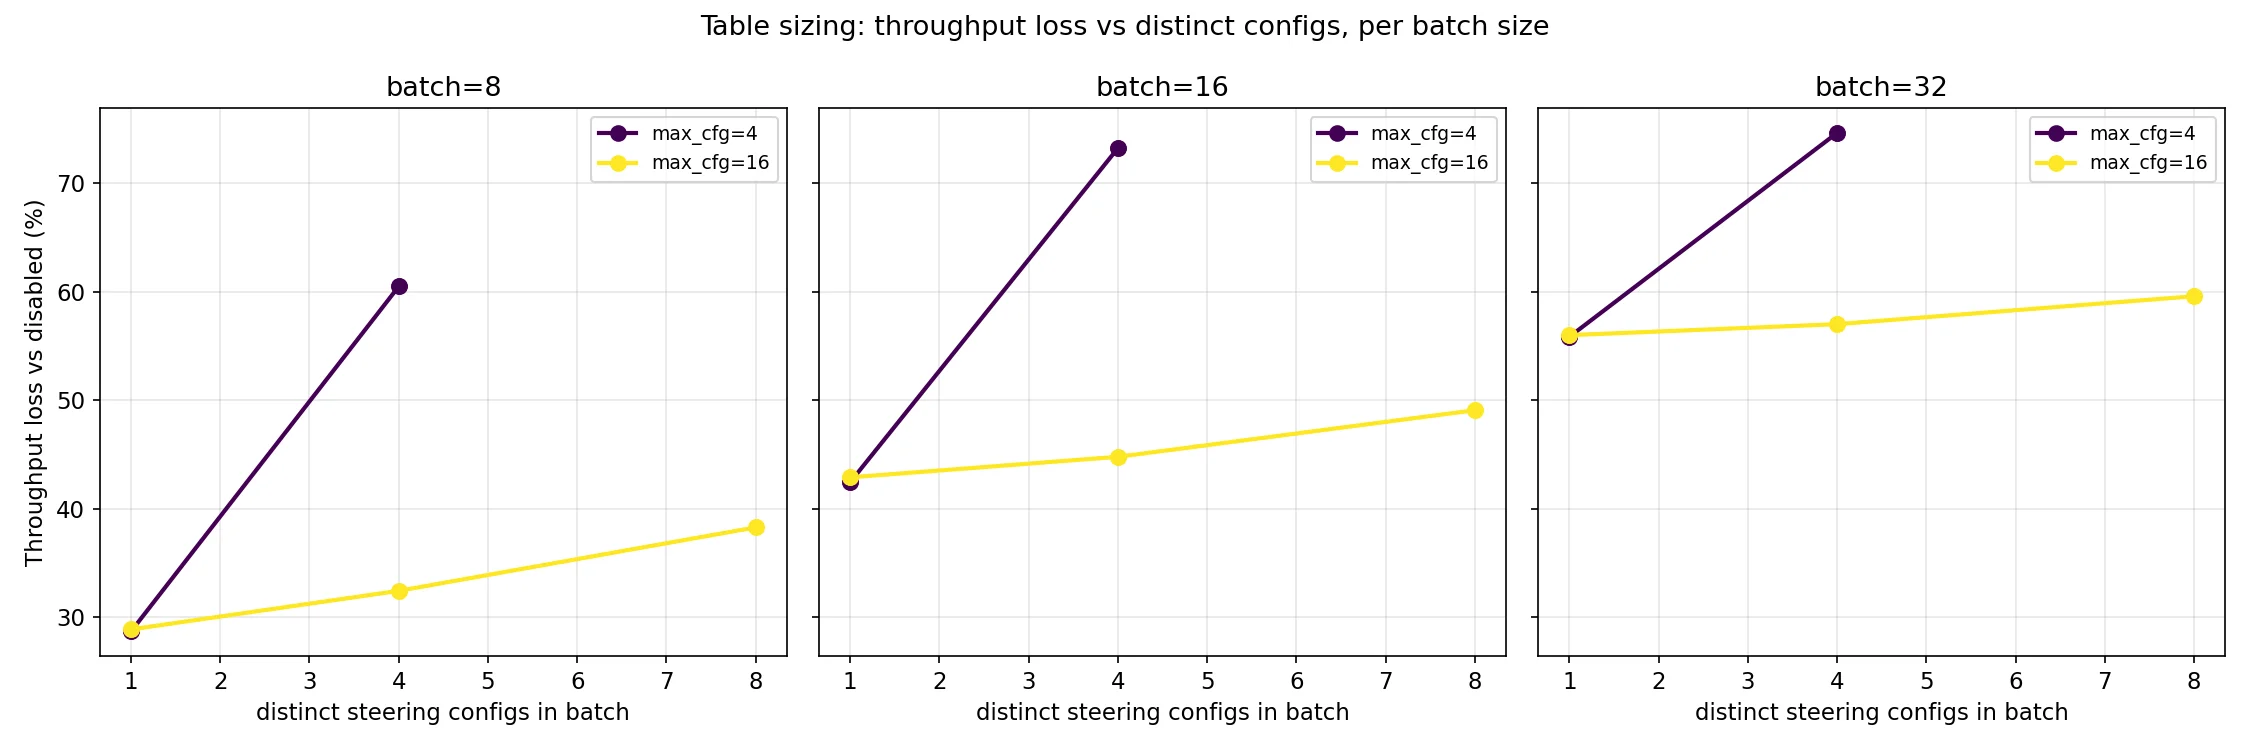
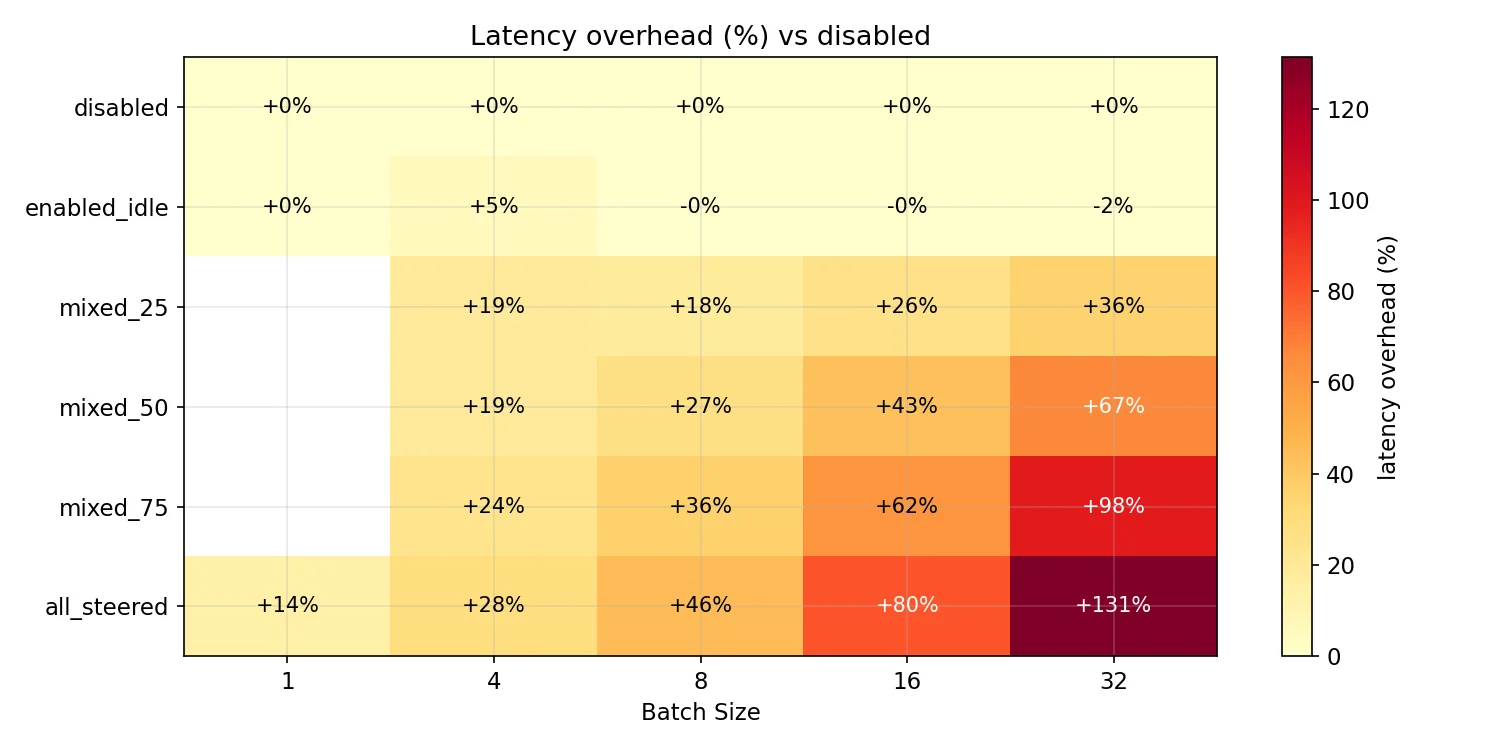
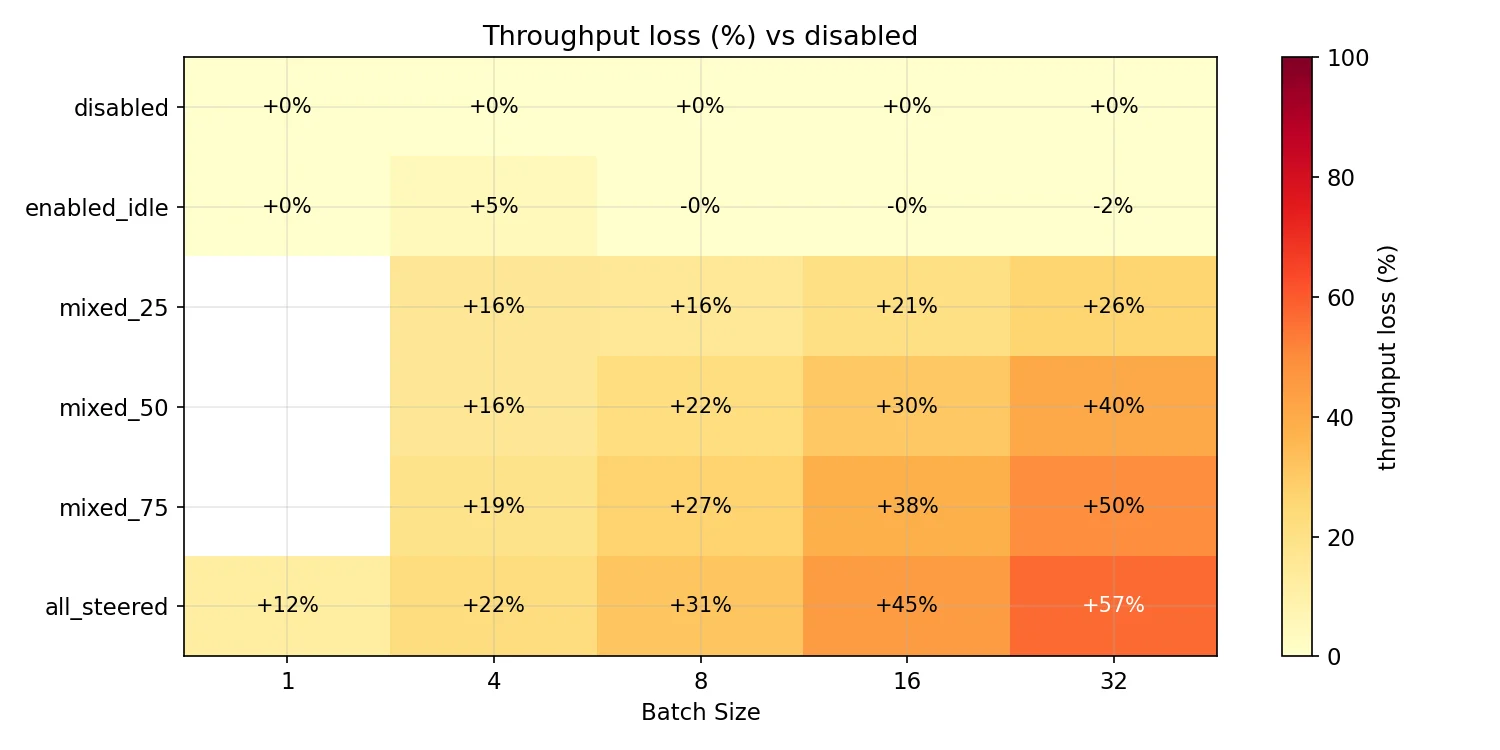
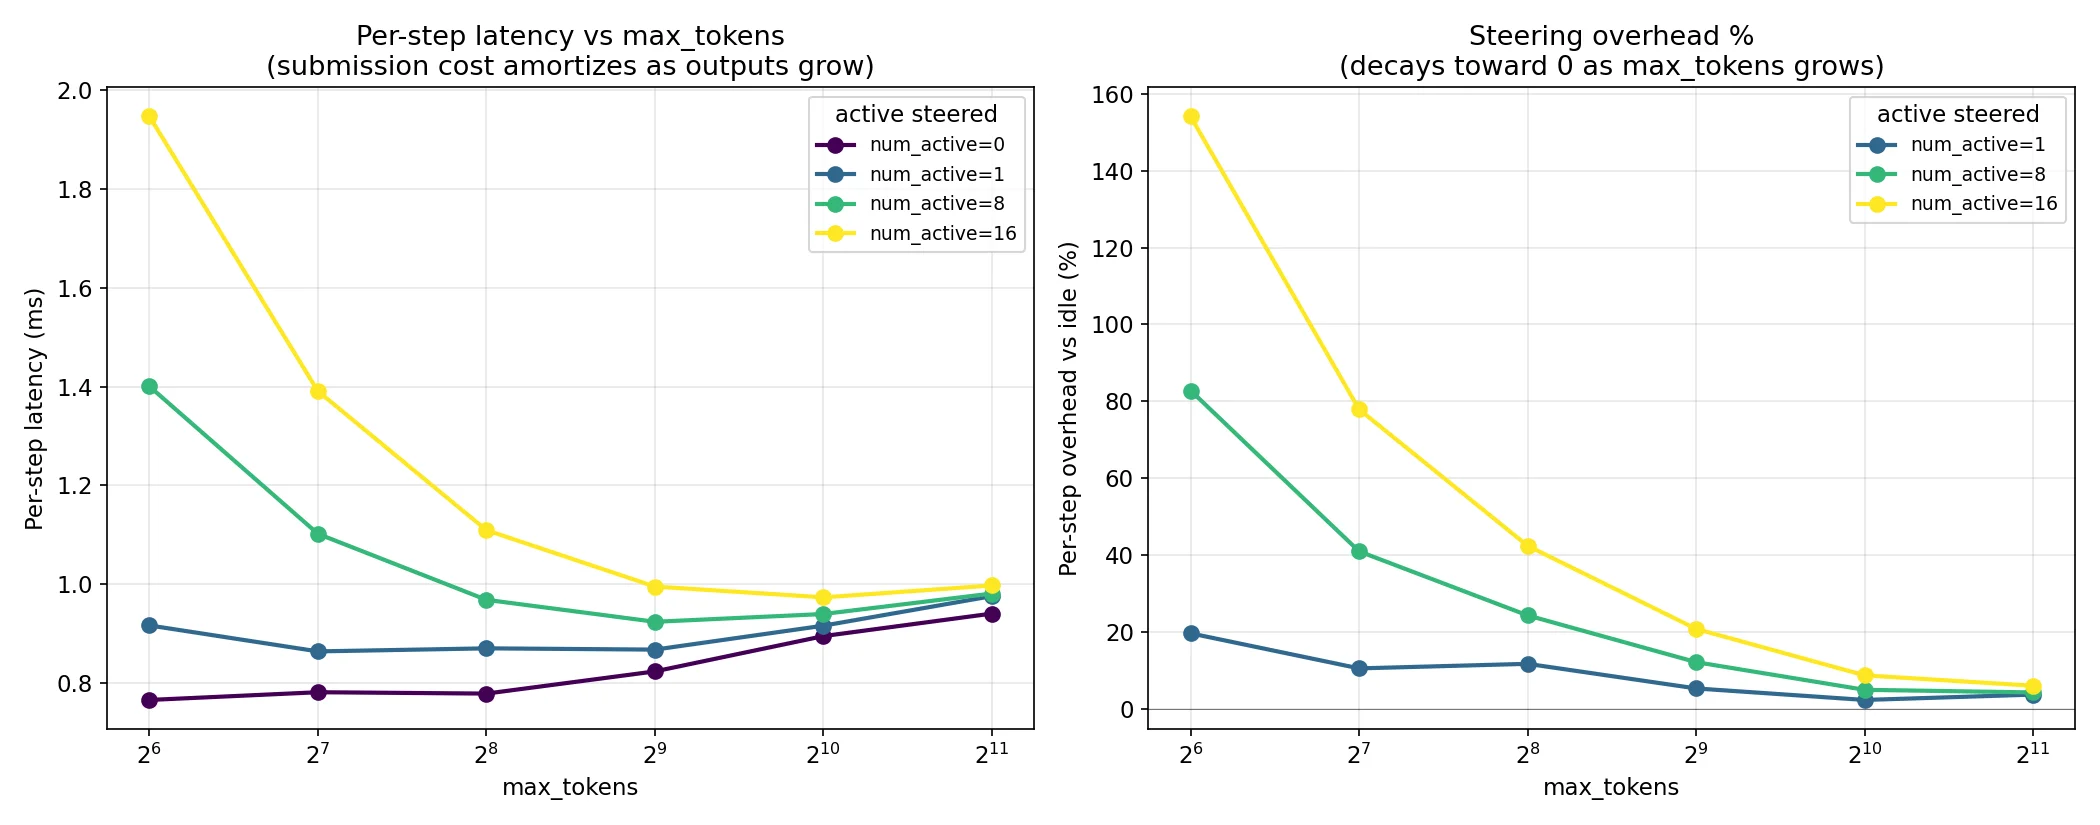
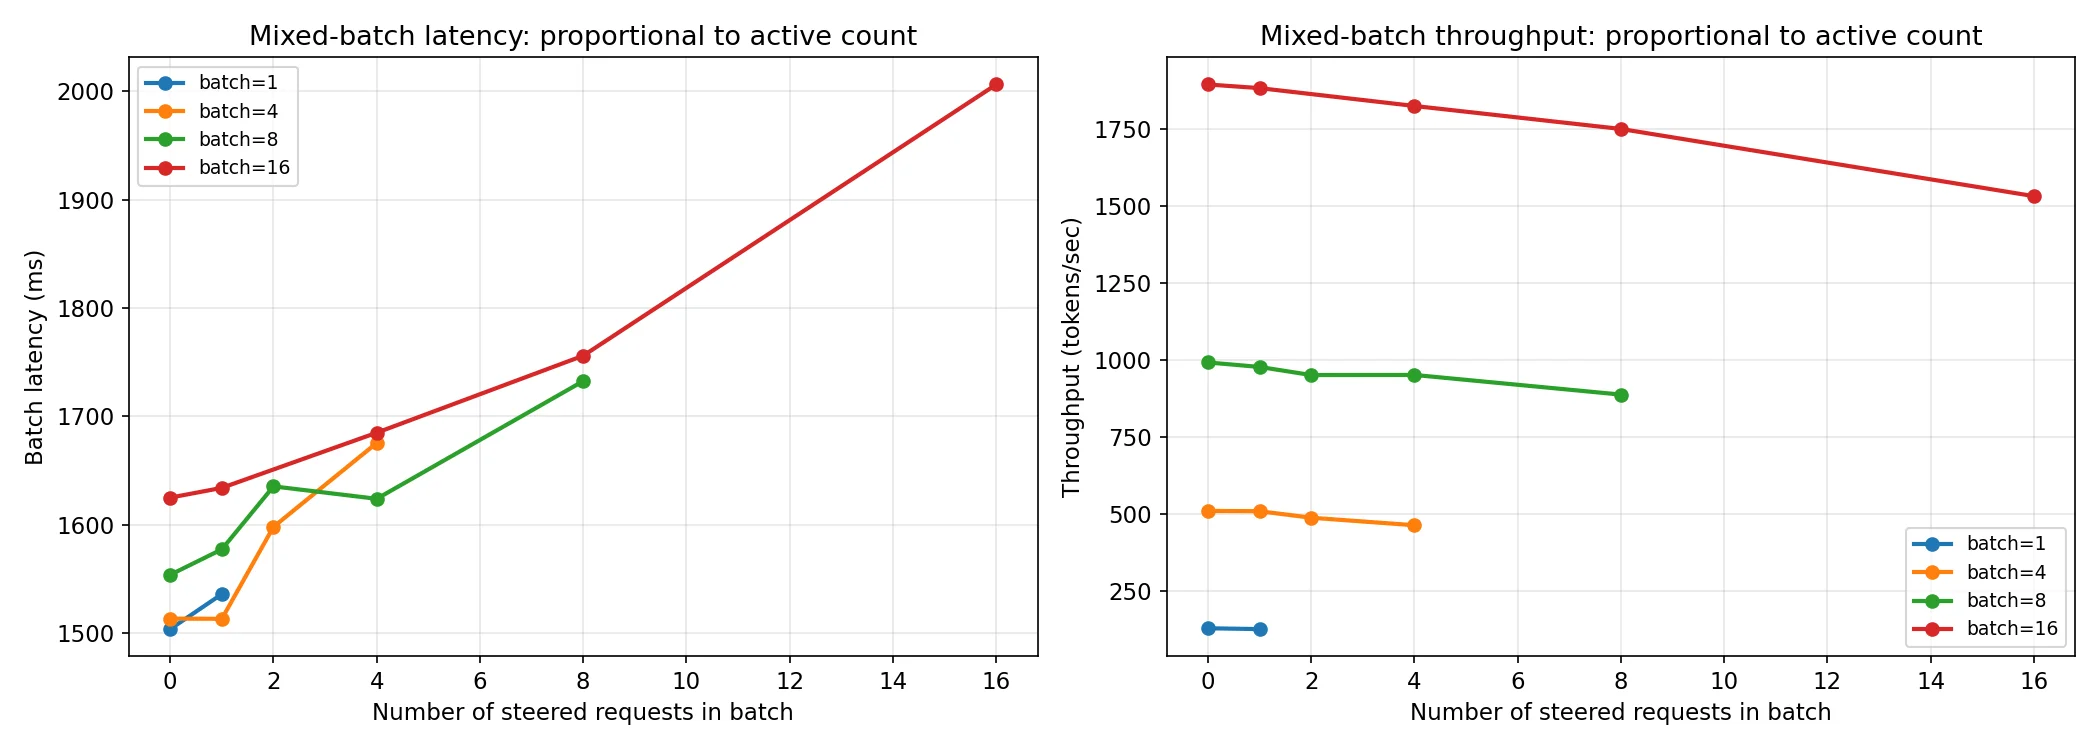
The bad news is of course that currently in some conditions there can be a relatively large overhead cost as the code is currently written. Latency overhead and throughput loss scales with the proportion of the batch that is being steered. Note that max steering table size is set to 64 for the charts below, to ensure that it isn’t a confounding variable.
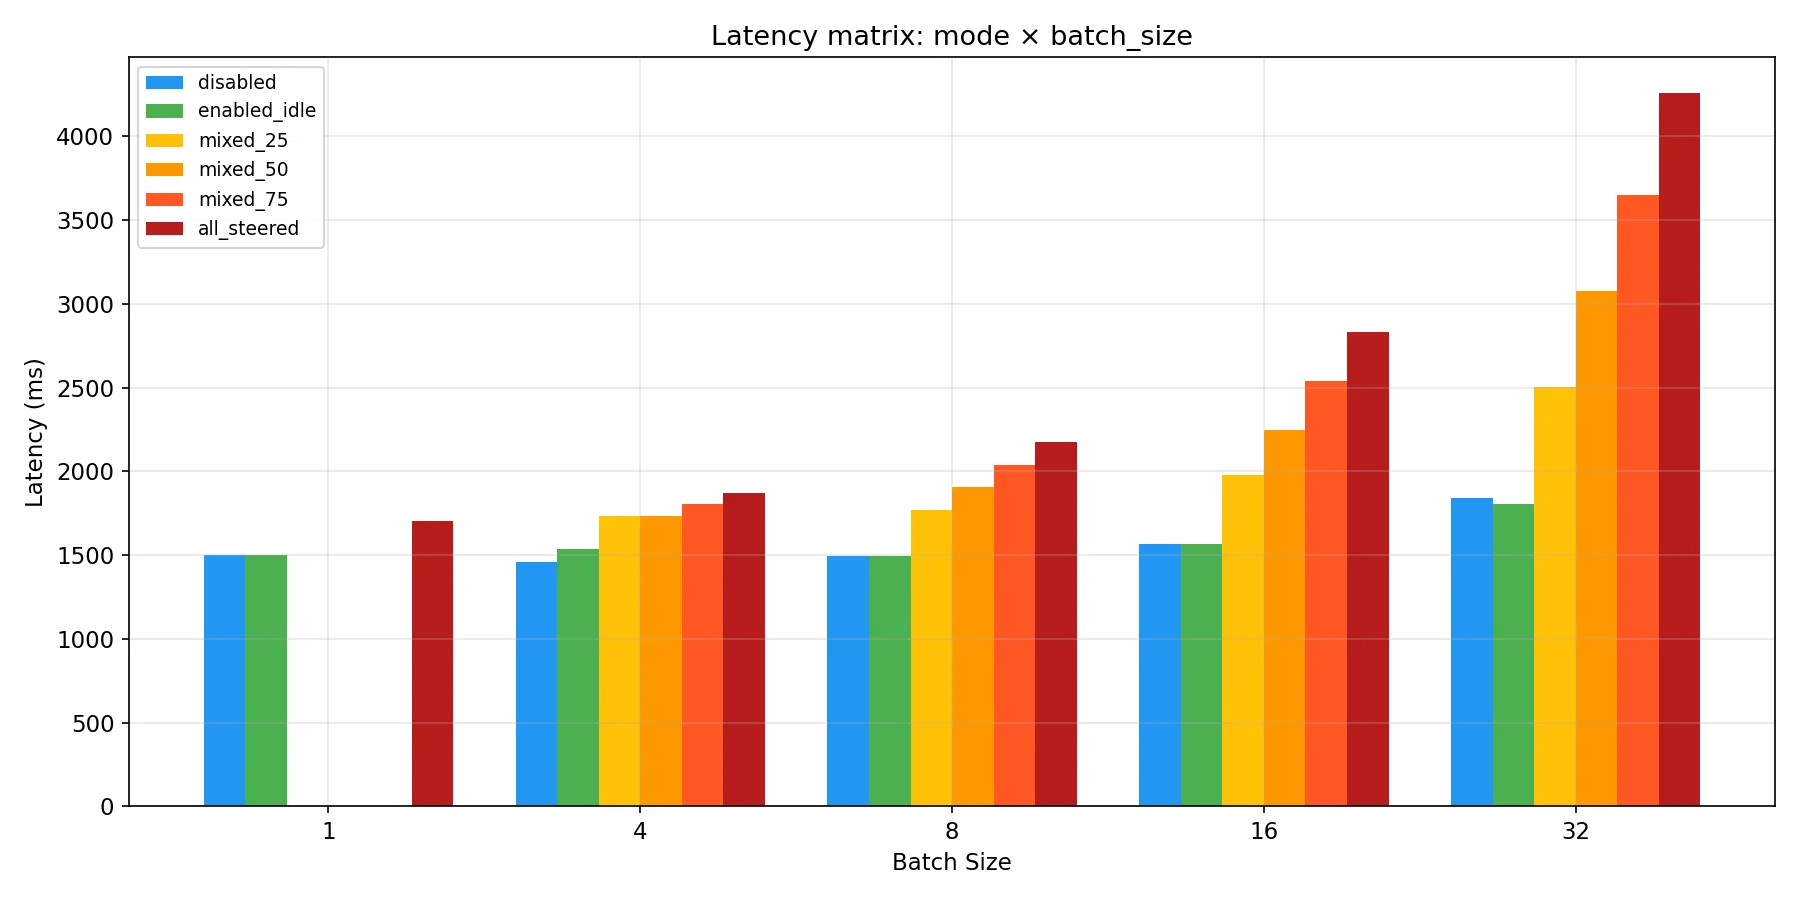
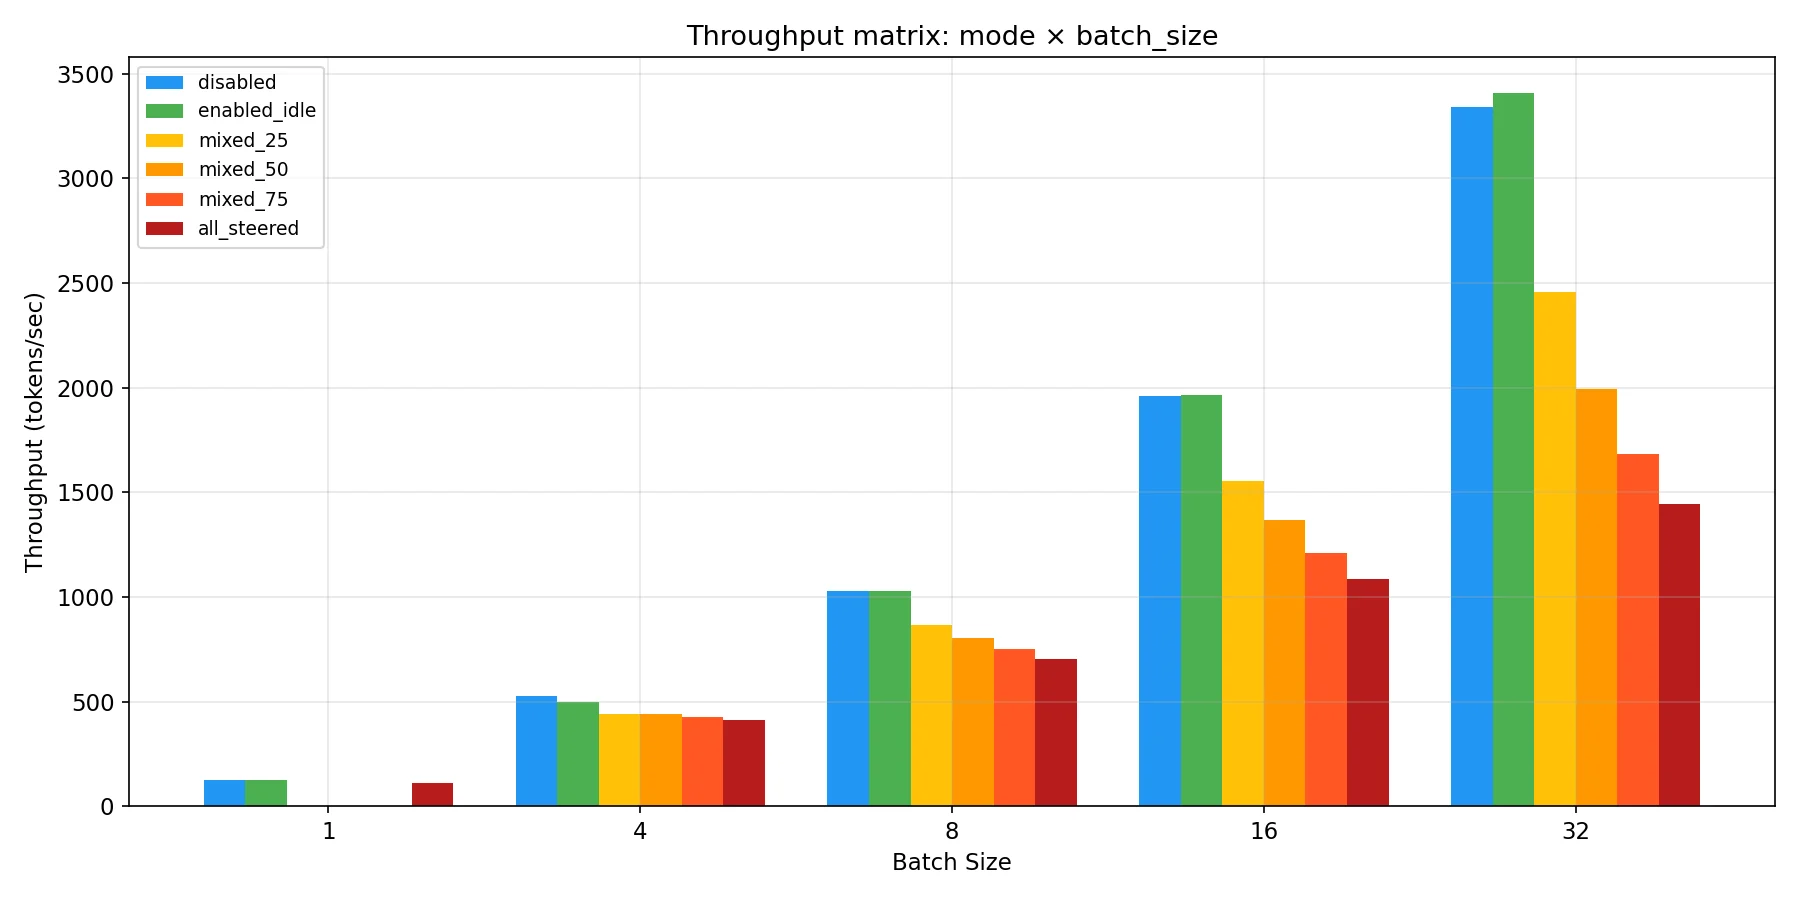
As you can see though, the performance hit increases with the proportion of requests in a batch that are being steered. Based on the data used to create the above chart we have this table of total batch overhead in ms before we make any fixes:
| b=4 | b=8 | b=16 | b=32 | |
|---|---|---|---|---|
| 25% active | +274 | +276 | +410 | +660 |
| 50% active | +277 | +410 | +678 | +1236 |
| 75% active | +345 | +544 | +973 | +1805 |
| 100% active | +413 | +681 | +1261 | +2417 |
| b=4 | b=8 | b=16 | b=32 | |
|---|---|---|---|---|
| 25% | 274 | 138 | 103 | 83 |
| 50% | 139 | 103 | 85 | 77 |
| 75% | 115 | 91 | 81 | 75 |
| 100% | 103 | 85 | 79 | 76 |
When you divide these by the absolute number of active requests you get the table on the right, where you can see the per request latency increase converges to 75-77ms at batch size 32 across all levels of steering proportionality. The convergence comes from there being a roughly 90ms fixed cost to a batch with any steered requests, which amortizes across the others with higher batch size and more steered requests.
As I started to track down the reason for this, I first thought that maybe I had somehow broken the kernel fusion from the torch compiler by using an opaque custom op. I reached for nsys to start with so I could profile what was happening on the GPU. Looking at the diff between steering being on vs off, almost every kernel had the same number of launches and the total delta between the time spent of GPU was 95ms of overhead, about ~9% of the total difference in runtimes! This told me that I was looking in the wrong place. Two sets of kernel launches that were different from it did draw my attention though:
| kernel | disabled | steering | delta | delta GPU time |
|---|---|---|---|---|
| FillFunctor | 4092 | 75,900 | +71,808 | +85.2 ms |
| bfloat16_copy_kernel | 3 | 6,531 | +6,528 | +9.8 ms |
Investigating Populate
These both looked like they were coming from populating the steering table and index, which happen on the CPU side. So, time to look at the difference in CPU events from the nsys run.
| API call | disabled | steering | delta calls | delta time |
|---|---|---|---|---|
| cudaLaunchKernel | 69,206 | 149,270 | +80,064 | +247 ms |
| cudaEventSynchronize | 568 | 568 | 0 | +183 ms |
| cudaMemcpyAsync | 5,625 | 12,357 | +6,732 | +43 ms |
| cudaDeviceSynchronize | 2,012 | 2,012 | 0 | ~0 |
| cudaStreamSynchronize | 1,126 | 1,330 | +204 | +2 ms |
| cudaGraphLaunch | 294 | 294 | 0 | +1.5 ms |
| Total delta | ~87,000 extra | ~477 ms |
The cudaLaunchKernel, cudaMemcpyAsync, and cudaEventSynchronize deltas add up to 477ms — that’s ~49% of the wall clock time difference. Now we’re getting somewhere. This is the cost of zeroing table rows and copying steering vectors into them, and almost all of it is issued from one function: populate_steering_tables.
To confirm that and see the other half of the picture (the Python interpreter time nsys can’t see), I added wall-clock timing instrumentation around the major sections of the per-step path:
| source | per-step | % of ~5.1 ms |
|---|---|---|
| populate_steering_tables | 2.50 ms | 49% |
| Index build loop | 0.14 ms | 3% |
| Forward pass dispatch | 0.23 ms | 5% |
| Outside the three sections above | ~2.2 ms | 43% |
populate alone accounts for half of every per-step overhead. The other half splits roughly evenly between cudaEventSynchronize wait time caused by populate’s GPU back-pressure (~0.95 ms/step, ~43% the ‘Outside’ row) and something else needed more timing analysis to figure out. We’ll get into this after we go over populate more deeply.
Since we have narrowed down that populate_steering_tables accounts for so much of the performance hit, time for flamegraphs!
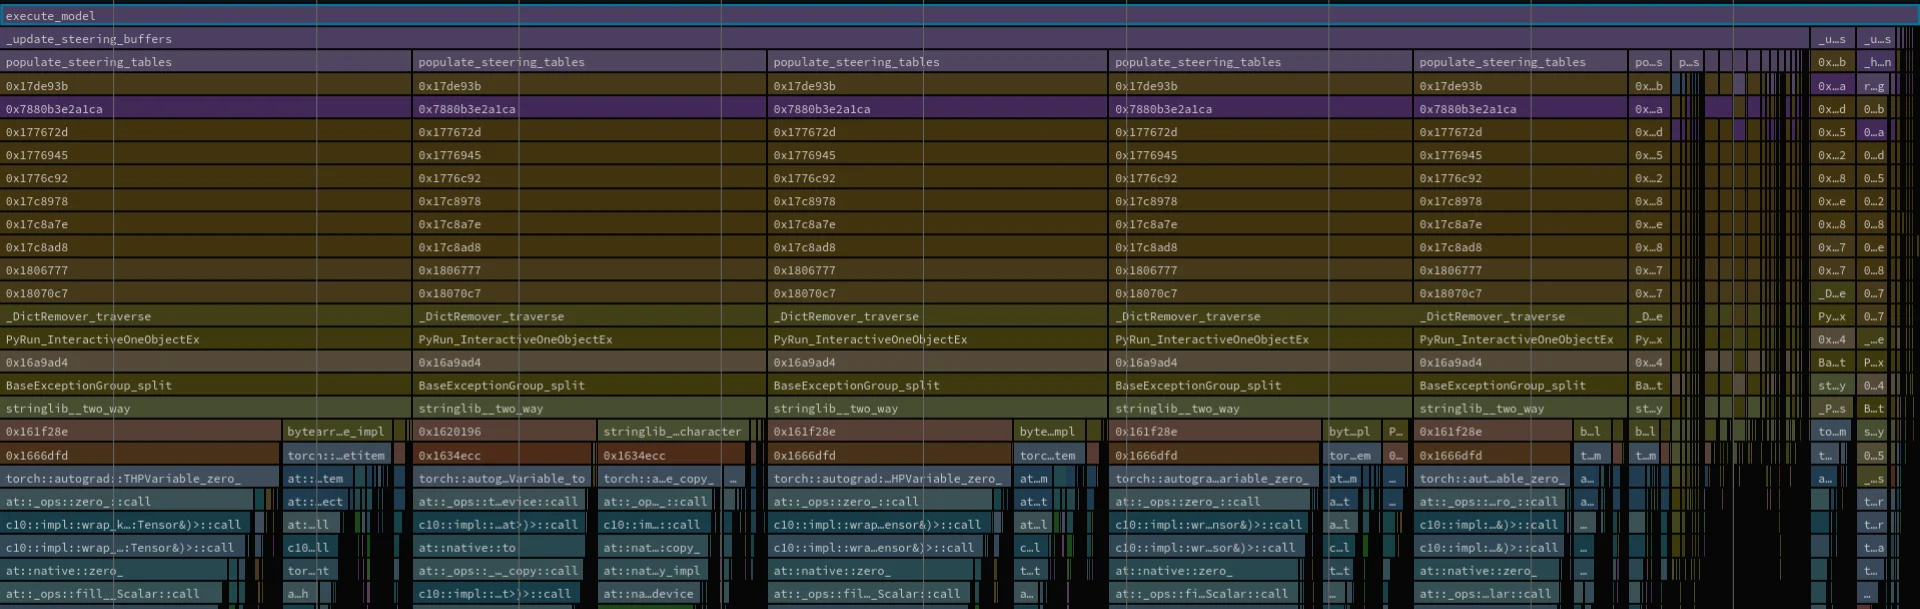
This flamegraph shows us a few different things. First, in green you can see the cudaLaunchKernel and cudaMemcpyAsync that we discovered with nsys. These being separate shows us that this happens in different branches. The second thing the flamegraph shows us is that there is a lot of time spent on ‘at::ops::zero::call’. The offending code for both of these is:
# Inside populate's loop, per (layer, hook) combination:

table[0].zero_()

if global_prefill is not None:
    table[1].copy_(global_prefill.to(table.dtype))
else:
    table[1].zero_()

if global_decode is not None:
    table[2].copy_(global_decode.to(table.dtype))
else:
    table[2].zero_()

for (config_hash, phase), row in self.config_to_row.items():
    if phase_global is not None and per_req is not None:
        combined = phase_global + per_req.squeeze(0).to(...)
        ... .copy_(combined ...)
    elif phase_global is not None:
        ... .copy_(phase_global ...)
    elif per_req is not None:
        ... .copy_(per_req ...)
    else:
        ... .zero_()
In every step, the code is ensuring that the zero vector sentinel row for unsteered requests is re-zeroed despite nothing in the code ever writing nonzero vectors to it! It’s also checking if it needs to set the global steering vector rows to 0 in every step, but this only needs to happen when when the steering API is used to clear the global config not in every step. It’s also zeroing out every row for hook points that have never been written to! Lastly, it’s also calculating the phase global + per request vector on every step.
There’s a ton of wasted work here, and some fundamental problems with the way our data is organized.
First off, we should avoid doing work when we don’t need to by adding a dirty flag to the SteeringManager itself that is set to true by anything that changes data and set to false when the manager handles everyting that needs to be done with that data. This will completely short circuit doing any work when none needs to be done. Also, if we remove the useless zeroing, we can get down to <10% of the kernel launches. Realistically, we should get rid of zeroing vectors entirely and use refcounting to classify a vector as released instead of zeroing it out.
We should also stop calculating the global + request vector every step, and instead frontload that calculation on registration of the config. This means that when changing the global vectors, we’ll have to take the difference between the previously set vectors and the new ones and use that to reset all of the per request vectors. This will mean that changing the global vectors is more expensive, but that’s a much rarer cost than calculating this repeatedly.
Finally, this needs to all be combined into a single contiguous tensor with per-hook, per-layer views. This will completely eliminate the branching structure and condense all of the cudaLaunchKernel + cudaMemcpyAsync into a single event each, removing all of the overhead they are responsible for.
The above optimizations should essentially remove the entire per step overhead introduced by populate_steering_tables, lowering it by ~49%. It’s quite likely that much of the cudaEventSynchronize overhead clears up from this too, bringing us to about ~67.7% predicted overhead reduction. (spoiler: this prediction turned out to be wrong, see Returning to Populate)
Pivoting to the Per Request Cost
I’ll come back to populate costs later on in the article, before I actually tried to deal with those I wanted to figure out where the rest was coming from.
Now onto the rest of it. After instrumenting every per decode step path in execute_model, sample_tokens and EngineCore.step the per-step delta across active steered requests 4 vs 16 turned out to be negligible at ~50us. This showed that the remaining overhead is actually not per-step, so I zoomed out and used NVTX to time the per request paths. This lead to:
| range | n=4 (per call) | n=16 (per call) | per-call delta |
|---|---|---|---|
| LLM._add_completion_requests | 338.3 ms | 1292.7 ms | +954.4 ms |
| LLM._run_engine | 1699.6 ms | 1715.8 ms | +16.2 ms |
| LLM._run_completion (parent) | 2037.9 ms | 3008.5 ms | +970.5 ms |
LLM._run_completion is composed of LLM._run_engine and LLM._add_completion_requests. The per request delta lives in the _add_completion_requests calls. When I compared the numbers for an unsteered submission to a steered one, it comes out to 1.2 ms vs 80 ms. That means there’s a 79.6 ms overhead per request that I previously thought was per step! The good thing about this is that for higher max_tokens and longer responses (the more common workload) this cost gets amortized over the token length. This can be seen in the chart below:
That’s not enough though, I’d like this to be able to be performant for short length workloads too. So next, another layer deep on the timing.
| range | per-request (median) | % of submission | scope |
|---|---|---|---|
| _render_and_add_requests:plain | 0.11 ms | — | unsteered baseline |
| _render_and_add_requests:steered | 78.5 ms | 100% | full steered submission |
| ↳ input_processor.process_inputs | ~17 ms | 22% | tokenize + create EngineCoreRequest |
| ↳ engine_core.add_request | ~62 ms | 80% | submit to engine core |
| ↳ preprocess_add_request | ~62 ms | 80% | (this IS the bulk of engine_core.add_request) |
| ↳ EngineCore.add_request_inner | ~5 μs | ~0% | scheduler enqueue (negligible) |
It seems to be split 80/20 across input_processor.process_inputs and preprocess_add_request. When I looked at the function, it seemed like the most likely candidate was hash_steering_config.
def hash_steering_config(effective_vectors):
    if not effective_vectors:
        return 0
    canonical = {hp: sorted(vecs.items()) for hp, vecs in sorted(effective_vectors.items())}
    data = str(sorted(canonical.items())).encode()
    return int(hashlib.sha256(data).hexdigest()[:16], 16) & 0x7FFFFFFFFFFFFFFF
It’s casting all of the floats to strings! When timing this, I got 27.7 ms/call and it runs for both prefill and decode configs. This means it’s ~52ms of the 62ms time. We can rewrite this as:
def hash_steering_config(effective_vectors):
    if not effective_vectors:
        return 0
    h = hashlib.sha256()
    for hook in sorted(effective_vectors.keys()):
        h.update(hook.encode())
        layer_dict = effective_vectors[hook]
        for layer_idx in sorted(layer_dict.keys()):
            h.update(layer_idx.to_bytes(4, "little"))
            arr = np.asarray(layer_dict[layer_idx], dtype=np.float32)
            h.update(arr.tobytes())
    return int(h.hexdigest()[:16], 16) & 0x7FFFFFFFFFFFFFFF
By skipping the string conversion entirely, I was able to get this down to 1.9 ms/call and bring down the hashing time to ~7% of what it was before. Another good thing to do is to cache the hash per unique steering vector, this way we don’t have to calculate it on every request. Of course this only skips ~3.8 ms per request and only when requests share a vector, but this could add up if we were doing global steering on every request that comes through the inference server.
The remaining 20% of the per request overhead is in input_processor.process_inputs where it has sampling_params = params.clone(), which does copy.deepcopy(self) which ends up deepcopying the entire steering vectors dict. We can pre-populate this with a memo, which it will check before recursing and return by reference instead of deepcopying. This ends up shaving another 13.3 ms off of the per request overhead, taking it down to 15.6 ms. This is a full 80% cost reduction from our original number! I’m pretty happy with this. I can always dig deeper to try and shave more time off, but we’re hitting the point where the effort to performance tradeoff is going to be diminished.
Let’s look at the max tokens sweep again to show the difference
Before:
After:
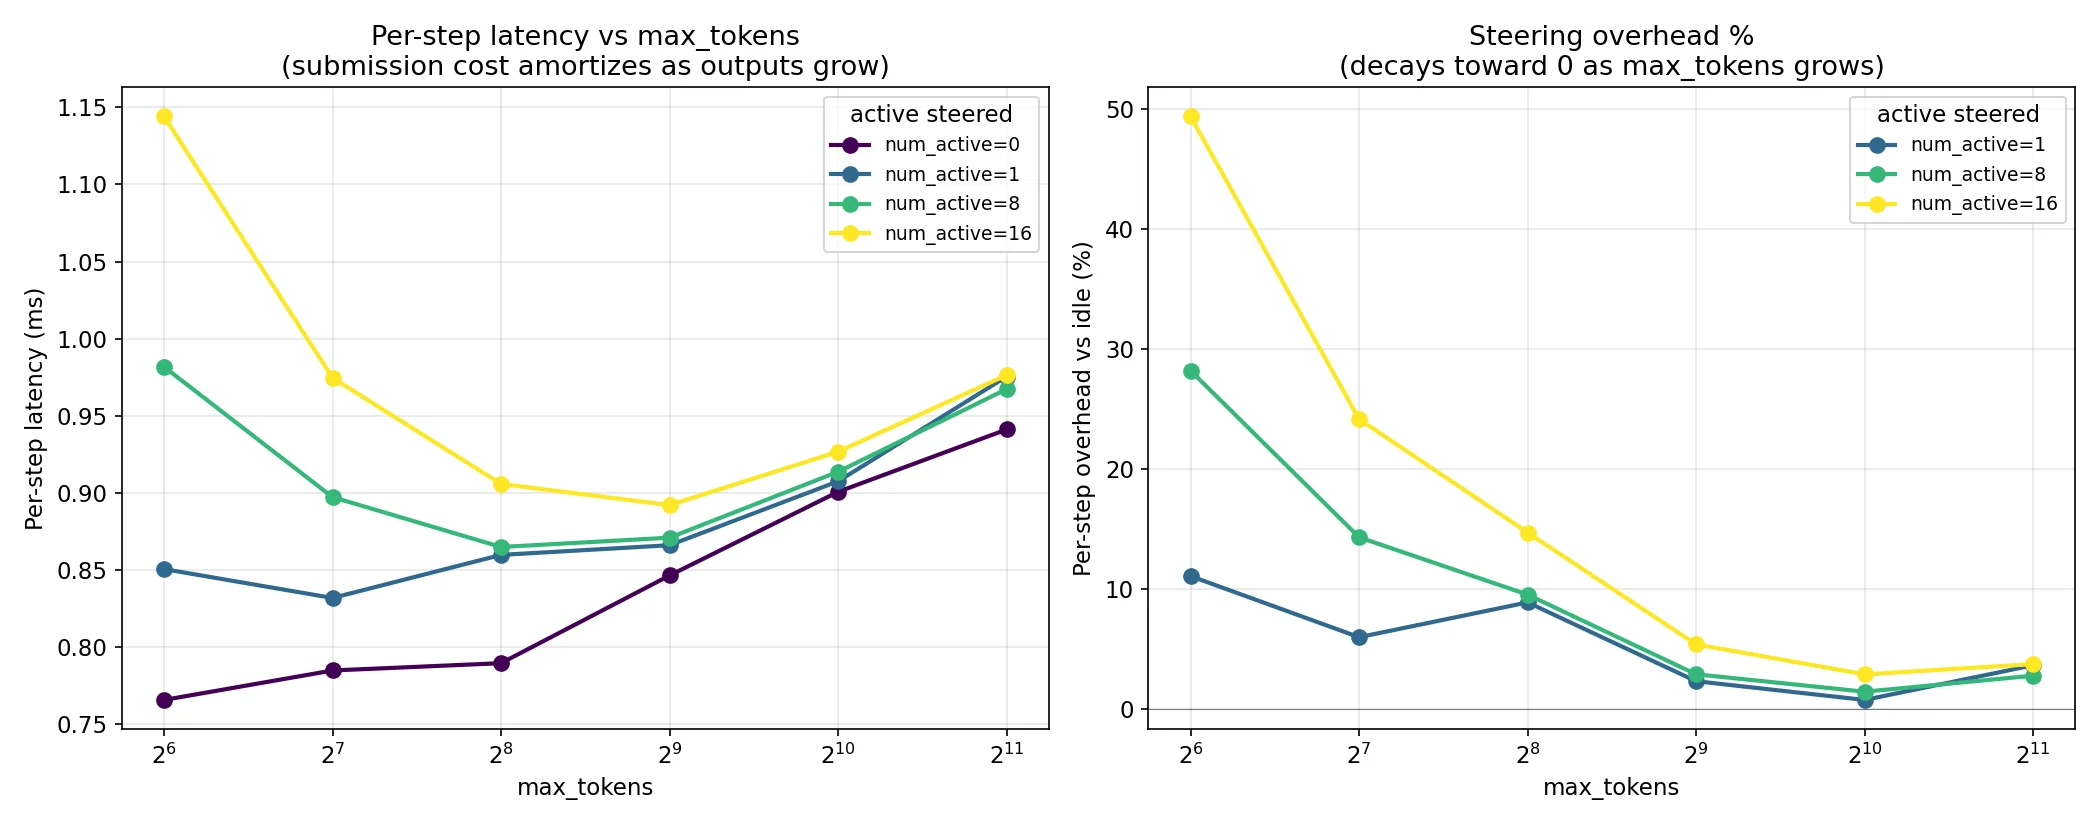
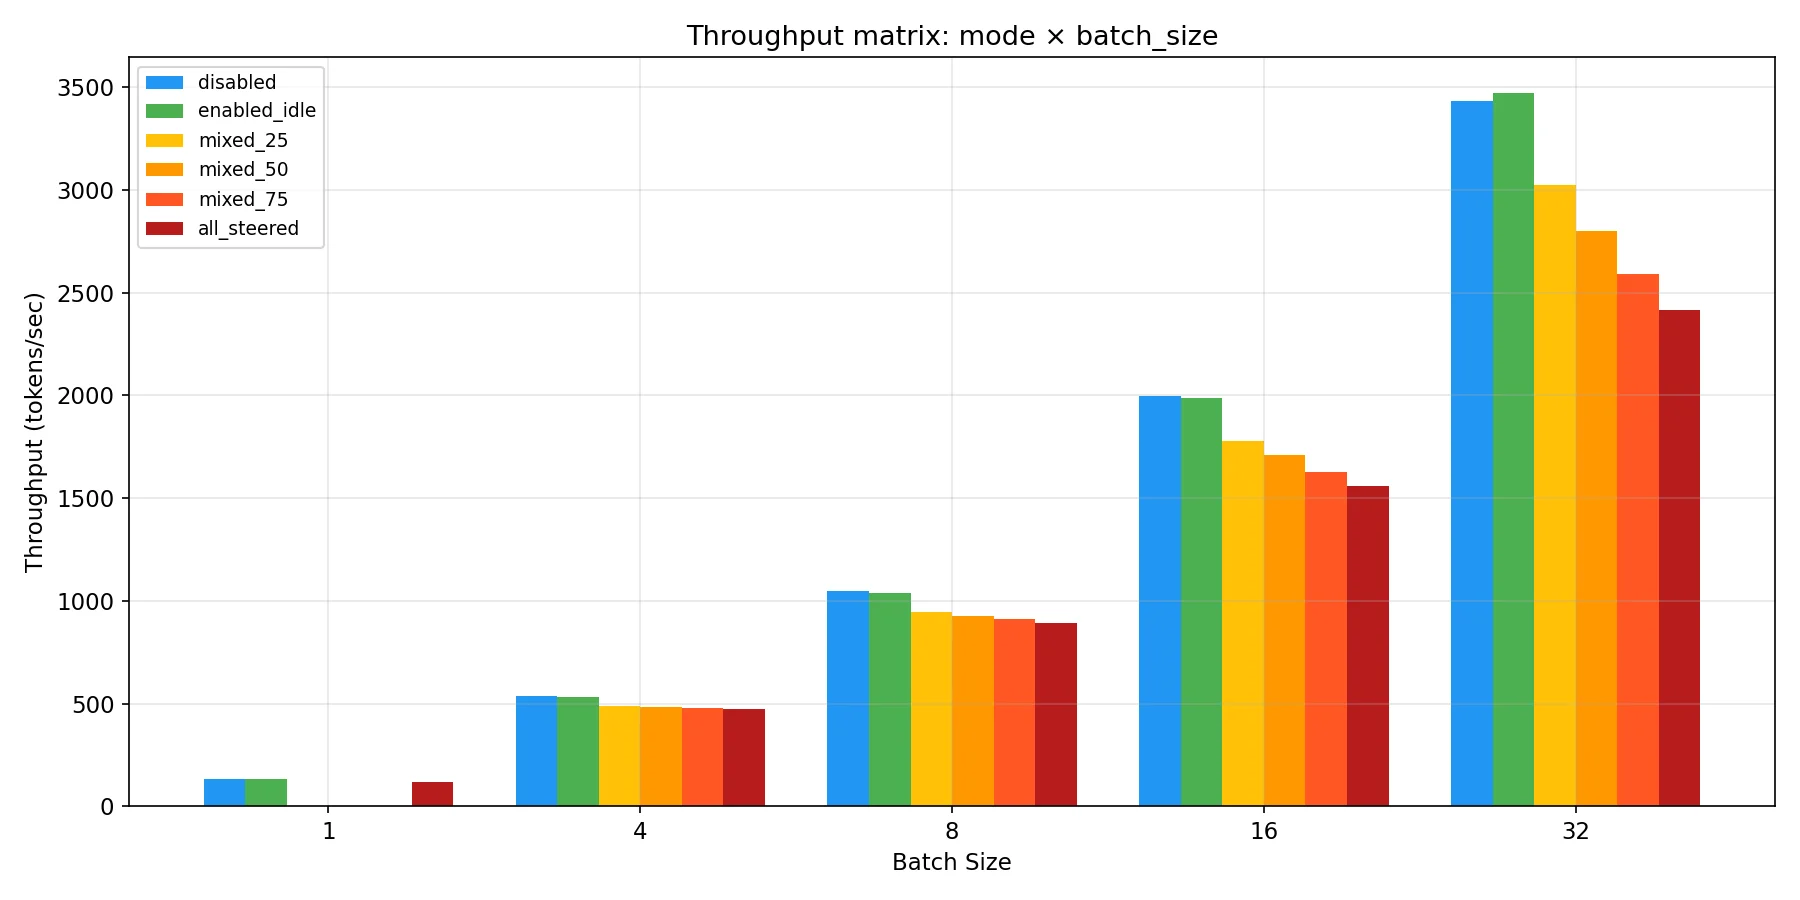
Clear win! The throughput benchmark shows much better scaling with active requests after these changes too.
That’s it for the per request costs for now, there’s more to do here but it will be part of future work since we took care of most of it. I’ll say more about what’s left in the conclusions section.
Returning to Populate
Okay, but what about populate_steering tables? We identified ~67% of the overhead that we could cut here right? Well, unfortunately it didn’t turn out to be so simple. Sure the 2.5 ms per step was accurate, but it turns out I was measuring CPU time with time.perf_counter here without considering that much of that time was already overlapped with GPU forward passes. I figured this out in the process of shipping two of the fixes I mentioned, the dirty flag cache and the batched copy per layer. I didn’t do any of the others, because I predicted that given the new information they would only save ~1% of the overhead.
After implementing the batched copy, about 0.65 ms per call turned out to be on the critical path. Before the caching fix, this would have been a 0.65 ms per step cost which would have added up. Afterwards, it turns out to only happen when the steering tables need to actually change. If you have a lot of steering config churn, this is a big deal. If not, then it turns out to be kind of disappointing. In the benchmarks I ran, it only runs twice instead of on every decode because the vectors were shared (this would resemble the global case). In the distinct vector benchmarks the populate cost climbs slightly because the dirty flag fires on every register_config, but it’s still only ~25 ms of the remaining 666 ms and dominated by the per request cost.
| batch | postfix-hash | postfix-populate | delta |
|---|---|---|---|
| 1 | 1590 ms | 1550 ms | −2.5% |
| 4 | 1621 ms | 1555 ms | −4.1% |
| 8 | 1722 ms | 1657 ms | −3.8% |
| 16 | 1963 ms | 1900 ms | −3.2% |
| 32 | 2545 ms | 2481 ms | −2.5% |
Lesson learned, check how much of the CPU time is overlapped with GPU time before assuming it will actually fix much.
The contiguous tensor for the steering tables will be a more involved optimization that I wanted to leave for follow up work that I’ll include in my next article about this project. We’ll end up using a custom Triton kernel for it because Pytorch can’t really express the write “contiguous[hook, layer, row, :] = global_phase[hook, layer, :] + per_request[config_hash, phase, hook, layer, :]” as one operation since it’s from two sources. We could build the dense tensor on the host side, but transferring it over PCIe would end up taking just as long (even at small max configs sizes) as what we’re doing now since we can’t transmit just the sparse delta the way we can now. To really deal with the remaining overhead of the populate function, we have to have a way to send just this sparse delta in a single operation and scatter to the steering tables on the GPU at once. It also enables us to handle all 3 hook points at once, which would save us from tripling the per layer forward pass dispatching, which is our primary remaining overhead outside of the remaining per request cost.
Conclusions
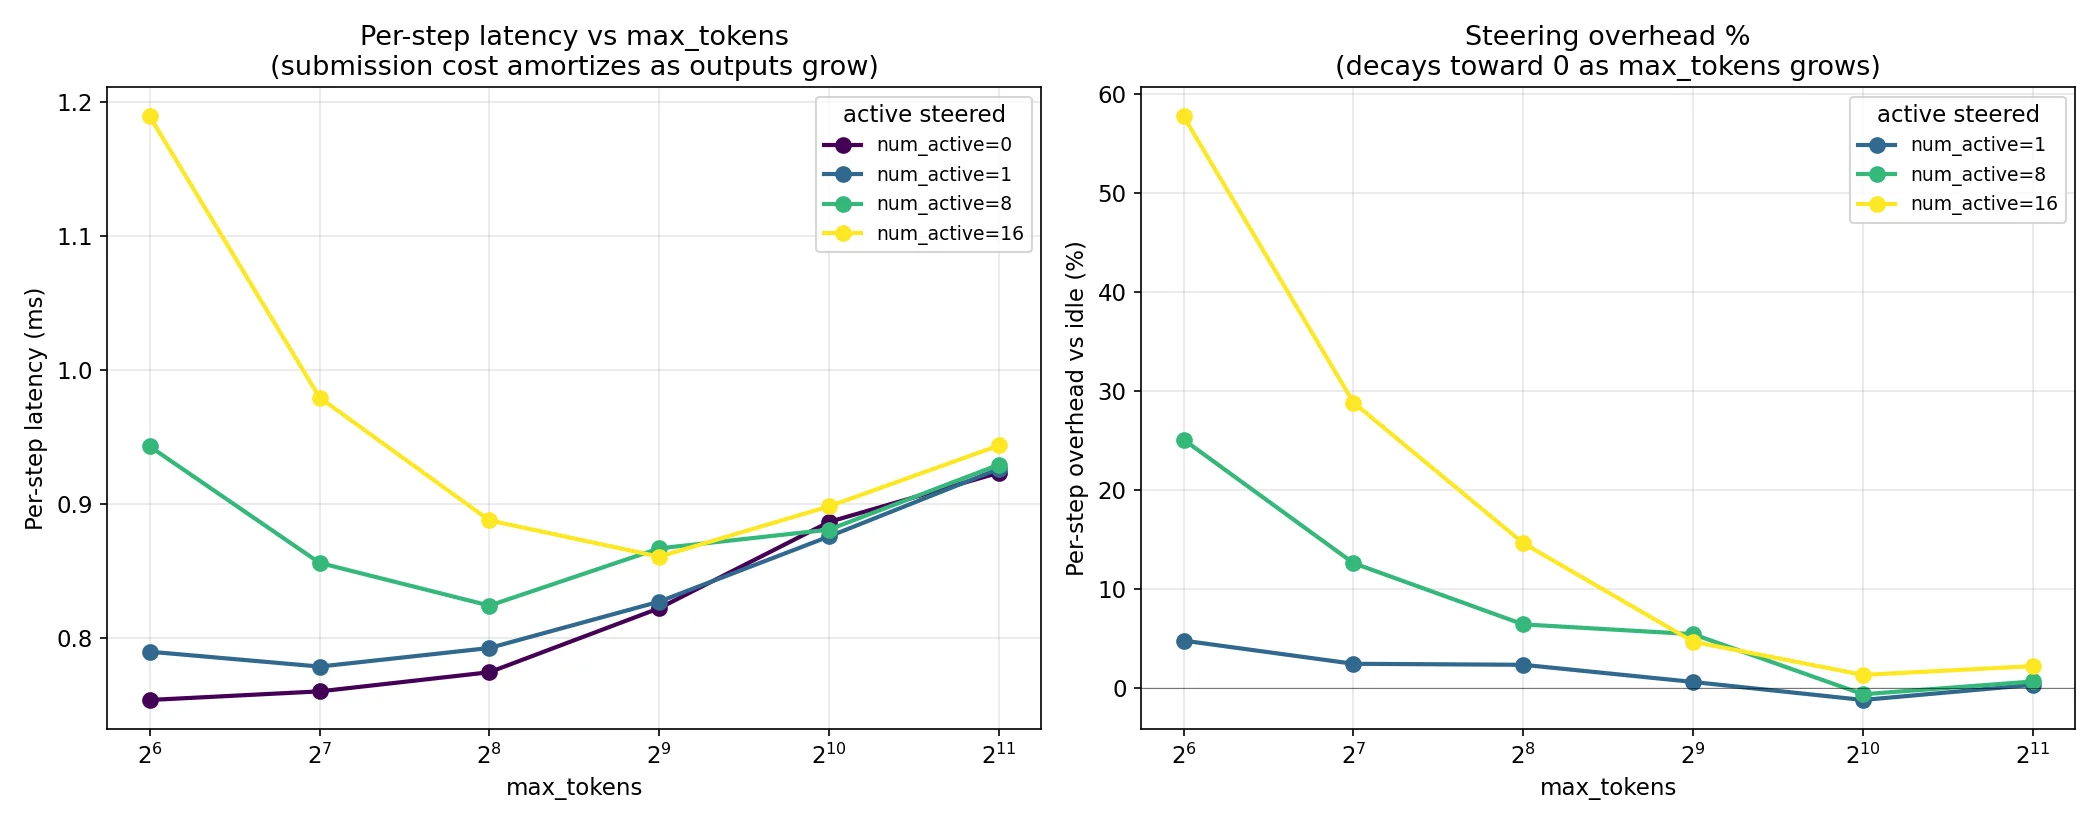
So where does that leave us? Well, lets look at the benchmarks after both sets of fixes. This time there will be a few more, since the dirty flag cache made our shared and distinct vector cases different.
The max tokens sweep shows that per-step latency and throughput overhead converge to almost nothing, roughly ~2% based on the numbers behind the chart. The lower max tokens are still affected by the remaining per request overhead, but in the large majority of common workloads (chatbots, agents, etc) any realistic token count will have this cost amortized across them.
We’ve already established that enabling steering and having 0 steered vectors is essentially free in our benchmarked cases, but below is a close look at how this scales per request after the changes made along the way. At BS=16, N=16 we’ve recovered ~500 tok/s throughput and ~800 ms latency from the optimizations.
The absolute numbers remaining at this scale are 666 ms. Our generation times here are 30 full seconds, so this overhead is really negligible until we start approaching frontier regimes where we hit multiple linear scaling costs at once.
The full breakdown of what the remaining 666 ms is composed of is:
| source | est. ms | scales with | Triton kernel helps? |
|---|---|---|---|
| Per-request submission (hash + register_config) | ~256 | num distinct configs | no |
| Per-layer forward-pass dispatch | ~300 | per-step × layers × hooks | yes (primary target) |
| Phase transitions | ~80 | num requests | no |
| Populate on dirty steps | ~25 | num dirty events | partial |
At the scale of BS=512, N=512, the 16 ms remaining cost compounds to a full 8 seconds of submission cost per generate() call (granted this requires every request to need a distinct steering config). Even amortizing across 30 seconds makes this a 27% overhead. This means the work isn’t done yet, and the per-request submission cost is the dominant remaining overhead at larger batch sizes and at short generation lengths, and it’s the one optimization with the most leverage left to claim. Timing reveals that this is in the per layer loop in register_config’s new row path, where torch.tensor(list, device=‘cuda’) causes synchronous host-device transfer similar to what we identified in the populate function.
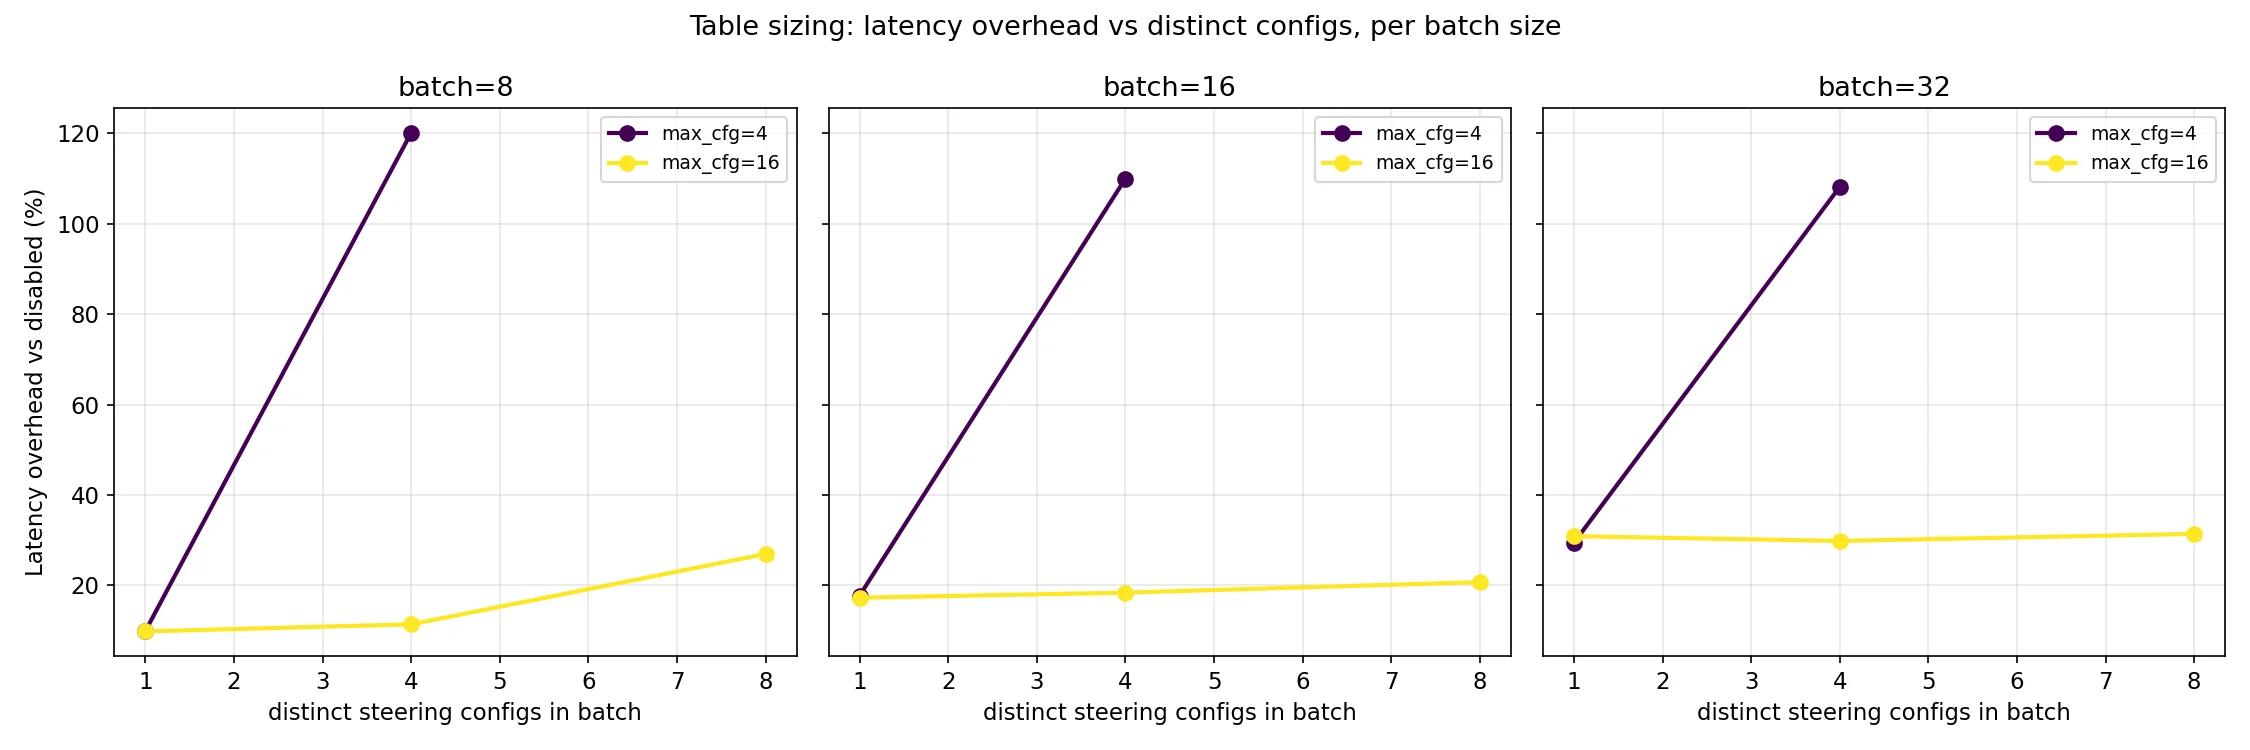
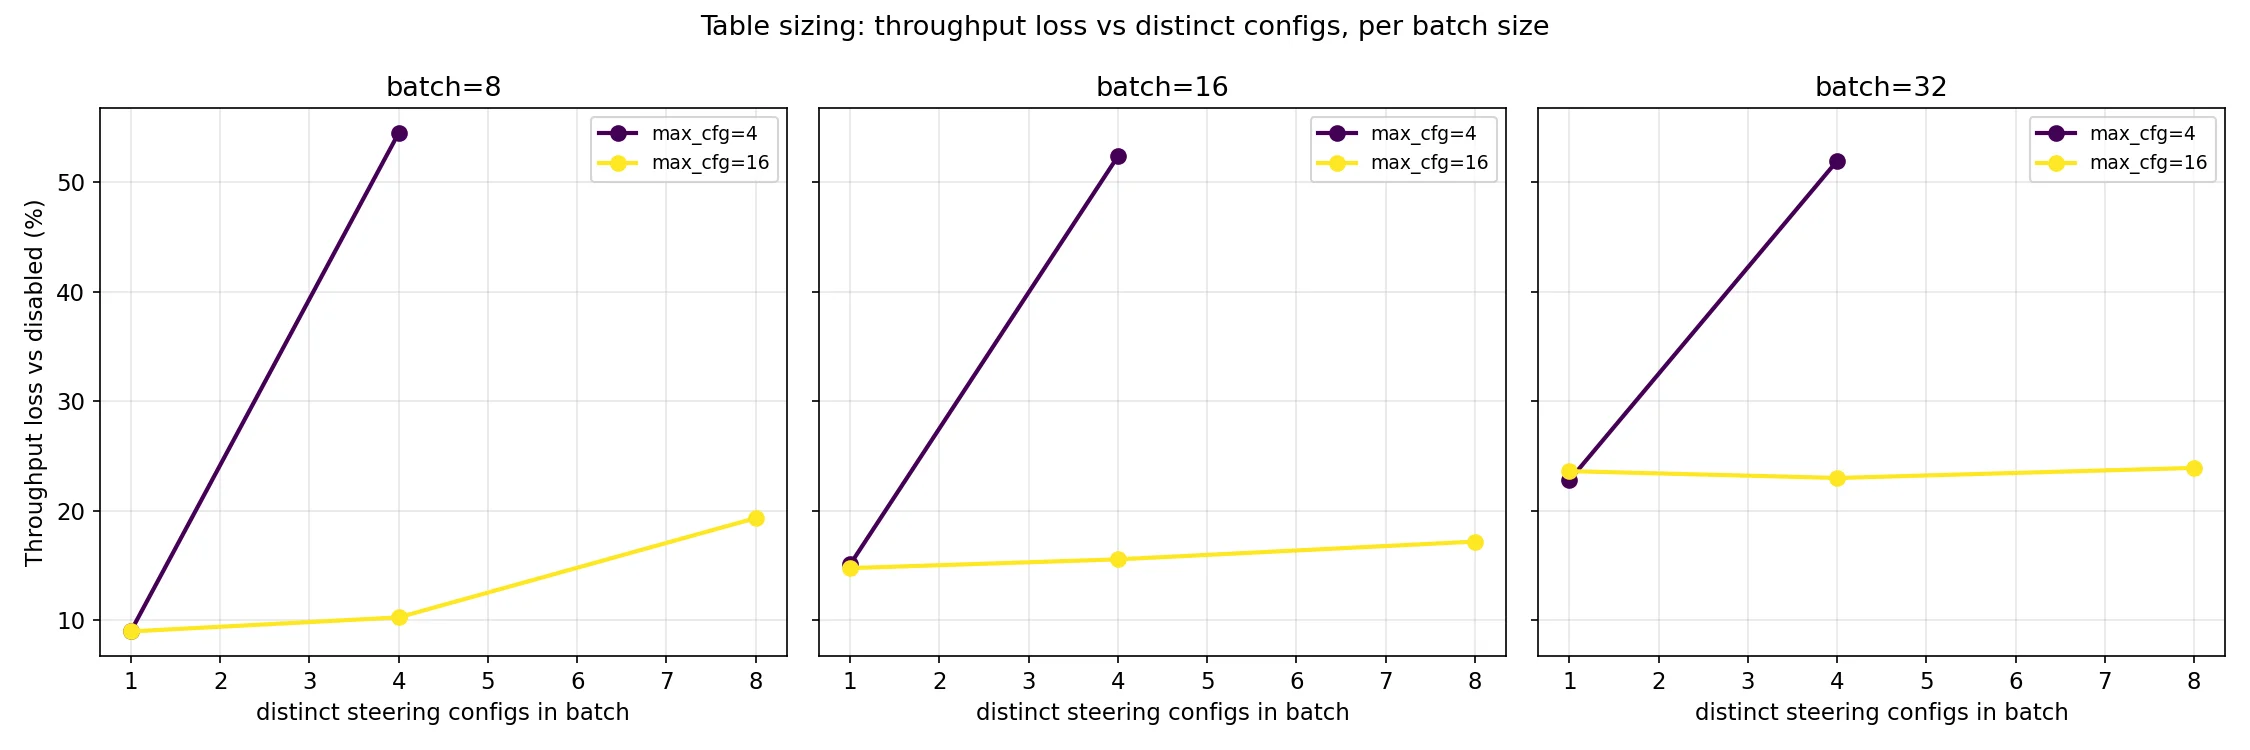
The post-fix charts below show that table sizing still matters. This is a fundamental property of having a maximum table size, which is required to keep CUDA graphs intact. If every request has a unique config, use ~batch size; if most share a config, use 4× the number you expect to see distinct in a batch.
As a final aside, I should note that benchmarks were run with VLLM_ENABLE_V1_MULTIPROCESSING=0 to enable debug instrumentation. This means that in production, the multiprocessing will introduce a few more ms of overhead for serializing the vectors being passed. We could cut this by passing named references to vectors that are stored worker side instead of the full thing. There’s already a named vector registration functionality, but the API layer resolves it to the vectors themselves instead of this happening on the worker side. This is a future optimization that I want to do.
H100 Validation
All the benchmarks above were run on 3090s, which are great for iteration but not what anyone is actually going to deploy this on. So I rented an H100 to see if the picture held on production hardware. All runs here used Gemma 3 in both 4B and 27B flavors, so this is also a first look at scaling behavior across model sizes.
The headline: enabled_idle is within noise of disabled across every configuration on both models. Turning the feature on without active steering requests is effectively free, which was the main design goal and is now confirmed on production hardware.
CUDA graphs stayed intact
Before looking at steering overheads I wanted to verify that the graphs are actually being captured and used. This is load-bearing for the whole design — all the “no conditionals, opaque custom ops, statically sized buffers” decisions were in service of keeping graphs intact, and if the graphs weren’t being captured none of the overhead numbers would mean what they look like they mean.
| model | graphs + steering | eager + steering | ratio |
|---|---|---|---|
| 4B | 738 ms | 4653 ms | 6.3× faster |
| 27B | 3246 ms | 8850 ms | 2.7× faster |
Graphs deliver the expected speedup so we know we’re on the fast path. Interestingly, graphs help proportionally less on 27B — which makes sense since when each kernel is doing more work the per-launch overhead that graphs eliminate is a smaller share of total time.
TPOT, TTFT, and E2EL
Now the main numbers. Time per output token across max_tokens:
| Model | Configuration | max_tok=256 | max_tok=1024 | max_tok=2048 |
|---|---|---|---|---|
| 4B | disabled | 5.1 | 5.3 | 5.2 |
| 4B | enabled_idle | 5.2 (+2.0%) | 5.2 (-1.9%) | 5.1 (-1.9%) |
| 4B | all_steered_shared | 6.1 (+19.6%) | 5.9 (+11.3%) | 5.9 (+13.5%) |
| 4B | per_request_n4 | 6.1 (+19.6%) | 6.0 (+13.2%) | 5.7 (+9.6%) |
| 4B | per_request_n16 | 6.9 (+35.3%) | 6.1 (+15.1%) | 5.9 (+13.5%) |
| 27B | disabled | 21.5 | 24.4 | 25.0 |
| 27B | enabled_idle | 21.5 (0.0%) | 24.4 (0.0%) | 25.1 (+0.4%) |
| 27B | all_steered_shared | 24.1 (+12.1%) | 26.8 (+9.8%) | 26.4 (+5.6%) |
| 27B | per_request_n4 | 24.4 (+13.5%) | 26.8 (+9.8%) | 26.1 (+4.4%) |
| 27B | per_request_n16 | 23.5 (+9.3%) | 26.7 (+9.4%) | 26.2 (+4.8%) |
TPOT converges cleanly with max_tokens. At 2048 tokens the per-token overhead is ~13.5% on 4B and ~4.8% on 27B, even with every request running a distinct steering config. The 27B number is lower in relative terms because the model has more work to do per step, so the fixed steering cost gets diluted further. This is the story I’d hoped to tell on the 3090 but couldn’t quite — on H100 the scaling works out the way the design suggested it should.
Now TTFT:
| Model | Configuration | max_tok=256 | max_tok=1024 | max_tok=2048 |
|---|---|---|---|---|
| 4B | disabled | 46 | 23.6 | 24.2 |
| 4B | enabled_idle | 46 (1.00×) | 23.8 (1.01×) | 26.7 (1.10×) |
| 4B | all_steered_shared | 870 (18.9×) | 143 (6.06×) | 144 (5.95×) |
| 4B | per_request_n4 | 893 (19.4×) | 129 (5.47×) | 135 (5.58×) |
| 4B | per_request_n16 | 615 (13.4×) | 129 (5.47×) | 144 (5.95×) |
| 27B | disabled | 181 | 85 | 86 |
| 27B | enabled_idle | 170 (0.94×) | 85 (1.00×) | 86 (1.00×) |
| 27B | all_steered_shared | 923 (5.10×) | 449 (5.28×) | 427 (4.97×) |
| 27B | per_request_n4 | 836 (4.62×) | 453 (5.33×) | 422 (4.91×) |
| 27B | per_request_n16 | 1453 (8.03×) | 442 (5.20×) | 424 (4.93×) |
This is where the cost actually lives. ~5× overhead on 4B and ~4× on 27B at 2048 tokens. Unlike TPOT, TTFT doesn’t amortize with max_tokens — it can’t, it’s a one-time registration cost paid once per request. This is the same per-request submission overhead I identified as the dominant remaining cost in the 3090 work, and it’s still the cost to beat.
What pulls the story together is E2EL, which is what users actually feel:
| Configuration | 4B | 27B |
|---|---|---|
| disabled | 4524 ms | 20580 ms |
| enabled_idle | 4527 ms (+0%) | 20908 ms (+2%) |
| per_request_n4 | 4784 ms (+6%) | 24823 ms (+21%) |
| per_request_n16 | 4848 ms (+7%) | 25137 ms (+22%) |
On 4B the overhead is about 6.5% end-to-end at 2048 max_tokens, which is the regime where TPOT dominates and the TTFT hit gets washed out. On 27B though it’s ~21.5%, and this is the thing I don’t want to soften: even though the TTFT ratio is better on 27B (4× vs 5×), the absolute TTFT cost is higher and the per-step cost is lower, so TTFT ends up dominating a larger share of E2EL. The counterintuitive takeaway is that the per-request submission overhead hurts more, relatively, on larger models for short workloads. If you’re running a chatbot on 4B with typical response lengths this is fine; if you’re running 27B for short turns, you’ll feel it.
Per-active-request scaling
One thing I wanted to confirm is that the per-request cost really is per active steered request and doesn’t scale with total batch size:
| BS | per-active cost (ms, distinct vectors) |
|---|---|
| 64 | 30.9 |
| 128 | 30.9 |
| 256 | 31.0 |
| 384 | 31.6 |
Flat from 64 to 384. If you’re running a server where only some requests need steering, the unsteered ones don’t pay for it. This is the behavior you want.
Worth noting: the H100 per-active-request cost is ~31 ms vs the ~15.6 ms number I landed on at the end of the 3090 work. These aren’t directly comparable — the 3090 benchmarks were run with VLLM_ENABLE_V1_MULTIPROCESSING=0 to enable debug instrumentation, and the H100 runs are with multiprocessing enabled. The serialization cost of passing vectors across the MP boundary is the main suspect for the difference, which is exactly what the worker-side named-vector resolution item on the roadmap is designed to eliminate.
Throughput amortization
The throughput side shows the same amortization story as the 3090 max_tokens sweep, but cleaner. This is the worst case — all requests steered with distinct configs:
| max_tokens | disabled (tok/s) | all-steered (tok/s) | vs baseline |
|---|---|---|---|
| 64 | 3590 | 1632 | 45% |
| 128 | 3670 | 2264 | 61% |
| 256 | 3638 | 2776 | 76% |
| 1024 | 3378 | 3134 | 93% |
| 2048 | 3200 | 3076 | 96% |
At 64 tokens you’re at 45% of baseline because every request eats the full submission cost and then barely generates anything. By 2048 you’re at 96%. For realistic workloads — chatbots, agents, anything that produces an actual response — you’re in the 93–96% range. For anything shorter than that, the fixed cost is exposed.
VRAM
VRAM cost is ~0.5 MB per configured steering slot, which at max_steering_configs=32 is under 0.02% of VRAM. This was true on 3090 and remains true on H100. Memory is not the constraint.
The design goals held up on production hardware: graphs intact, enabled_idle is free, TPOT amortizes cleanly, and memory is negligible. The per-request submission cost is still the thing to beat, and the H100 data agrees with the 3090 diagnosis about where to go next.
Optimization Roadmap
- Optimize config registration to further reduce per request overhead, the dominant remaining overhead at larger batch sizes and short workloads
- Name to vector resolution should happen on the worker side
- Write a custom Triton kernel for indexed scatter to steering tables
API Usage
After all that, I guess I should tell you how to use it!
Global
Global steering has its own API at POST /v1/steering/set where you send a json request body like:
{
  "vectors": {
    "post_mlp": {
      "14": [0.1, -0.2, 0.3, ...],
      "20": {"vector": [0.5, 0.1, -0.4, "..."], "scale": 2.0}
    }
  },
  "prefill_vectors": {
    "pre_attn": {
      "14": [0.3, 0.4, ...]
    }
  },
  "decode_vectors": {
    "post_attn": {
      "14": [0.2, -0.1, ...]
    }
  },
  "replace": false
}
You don’t have to include all three vector keys. The vectors key sets a steering config for both phases, while prefill_vectors and decode_vectors only set for those phases in particular. If you include vectors as well as one of the other vectors keys, it will combine the vectors additively. The replace key will reset all the steering configs and set only what you’ve included in the request.
The keys you can include inside the different vector top-level keys are “pre-attn”, “post-attn”, and “post-mlp” which are the different hook points for residual streams that you can specify. Inside these, you specify the number of the decoder layer you want to steer and then include either just the steering vector or { “vector”:
You will receive a response that looks like:
{
  "status": "ok",
  "hook_points": ["post_mlp", "pre_attn", "post_attn"],
  "layers_updated": [14, 20]
}
Either the list-of-floats form shown above or the binary blob form described in the Per Request section is accepted here. The wire-format optimization is only load-bearing on the per-request path where the API server parses a fresh body per request, so on the global endpoint the choice is purely a client-side convenience.
There is also an endpoint /v1/steering/clear which will zero out all vectors without needing to supply a request body.
Per Request
Per request steering is done via the extra_body key in the OpenAI completions spec. Since publication, I’ve changed the wire format for per-request inline vectors to a binary blob with a small JSON header (covered in part 2). The list-of-floats form shown further down still works for the global and named-module endpoints, but it is no longer accepted on the per-request path — that path now requires the binary format, because the JSON parse + ndarray construction tax on the asyncio event loop was the dominant remaining cost there:
import base64
import numpy as np
from openai import OpenAI

client = OpenAI(base_url="http://localhost:8000/v1", api_key="unused")

# Stack the per-layer vectors for each hook into a contiguous (num_layers, hidden_size) array
post_mlp_vecs = np.stack([vec_for_layer_15, vec_for_layer_20], axis=0).astype(np.float32)
pre_attn_vecs = np.stack([prefill_vec_for_layer_15], axis=0).astype(np.float32)

response = client.chat.completions.create(
    model="google/gemma-3-4b-it",
    messages=[{"role": "user", "content": "Hello"}],
    extra_body={
        "steering_vectors": {
            "post_mlp": {
                "dtype": "float32",
                "shape": list(post_mlp_vecs.shape),
                "layer_indices": [15, 20],
                "data": base64.b64encode(post_mlp_vecs.tobytes()).decode(),
            },
        },
        "prefill_steering_vectors": {
            "pre_attn": {
                "dtype": "float32",
                "shape": list(pre_attn_vecs.shape),
                "layer_indices": [15],
                "data": base64.b64encode(pre_attn_vecs.tobytes()).decode(),
            },
        },
    },
)
Each hook carries a stacked (num_layers, hidden_size) array along with a header describing the dtype, shape, and which layer index each row corresponds to. Decode on the server is a single np.frombuffer, which skips the per-float parse and per-row ndarray construction that the old format paid. An optional scales: list[float] field (same length as layer_indices) can be included on each hook to multiply each row, so the same packed bytes can be reused at different strengths across requests without re-encoding the blob.
For completeness, the original list-of-floats form looked like this and is still what the global and named-module endpoints accept, but submitting it on the per-request path will be rejected:
extra_body={
    "steering_vectors": {
        "pre_attn": {15: [0.1, 0.2, ...]},
        "post_mlp": {15: [0.3, 0.4, ...]},
    },
    "prefill_steering_vectors": {
        "pre_attn": {15: [0.5, 0.6, ...]},
    },
}
Otherwise, it works the same as the global steering endpoint except since it’s per request you don’t need the replace key.
Named Configs
As a way of helping the UX with this, I added named steering configs. As with the global endpoint, the inner vectors here can be supplied either as the list-of-floats form shown below or as the binary blob form from the Per Request section — register-time payloads only get parsed once per module, so the wire format doesn’t matter for performance. To register one, hit the POST /v1/steering/modules/register endpoint:
{
  "name": "creativity",
  "vectors": {
      "post_mlp": {"15": [0.1, 0.2, ...]}
  },
  "prefill_vectors": {
      "pre_attn": {"15": {"vector": [0.3, 0.4, ...], "scale": 2.0}}
  },
  "decode_vectors": None,
}
You can unregister a config so you can use the name for a different one with POST /v1/steering/modules/unregister:
{"name": "creativity"}
Finally, you can list currently registered configs with GET /v1/steering/modules:
{
    "modules": ["creativity", "safety", "formality"],
    "count": 3
}
Next Steps
- Minimize synchronous host to device transfer in the register_config new row path
- The optimizations for named vectors and a custom triton kernel for the indexed scatter to populate the steering tables more efficiently
- Benchmarks against other steering frameworks, not just vLLM without steering
- While I’ve been working on this, vLLM dropped their v2 model runner (gated behind a feature flag) that makes some changes to the way things work but I’m excited to dig into that and integrate it. It moves a lot of bookkeeping over from the CPU to the GPU so it should be a fun challenge
- I’ll also make a small python package for dealing with the steering API
I’ve also written an activation capture consumer plugin system that I want to tie in with my steering runtime to produce dynamic steering based on pluggable signal sources like the output of a probe or activation similarity to a feature vector, so that you can register auto steering configs that kick in whenever a prompt makes the probe fire. This enables some interesting applications. For instance, Anthropic’s Sonnet 4.5 model card (p. 89) shows that steering can make a model unaware it’s being evaluated, or at least suppress verbalization of that awareness. This could be applied conditionally to address eval awareness without affecting other generations. I think that you want to be able to control this kind of thing for evals but training it into the model with SFT or RL is a bad idea. If you do, then you lose the ability to see what the difference in behavior is when it thinks it’s being evaluated vs when it doesn’t. Beyond that, there’s this weird epistemic loop where you’re trying to make the model unaware that it’s being evaluated while you’re actively doing so in an effort to train it. This is why I think that conditional activation steering is important, even if it’s not always the most efficient way to get a model to adopt desired behavior vs say hot-swappable LoRAs.
At some point in all this, I want to get this upstreamed so that people who don’t just stumble across my work can use it.
If you have thoughts about other things that I should address, feel free to reach out to me on X where my handle is RhizoNymph.
Link
If you’re curious to see the code or try it out, its at [https://github.com/RhizoNymph/vllm]