Activation Steering Part 2: Electric Boogaloo
In my first blog on activation steering in vLLM (which you can read here) I walked through the work I’ve been doing adding support for steering vectors to vLLM. In it, I showed that in the end there was still real overhead vs the steering disabled case and detailed some things that I planned to do in the future to try and close the gap. Since then, I’ve tried these out and tried other things I hadn’t thought of back then that further profiling revealed I should tackle. In this post I’m going to go over what I tried, what worked, and what didn’t. I’m going to stick with the microbenches from my benchmark suite but at the end we’re going to compare the latency/throughput benchmarks that I posted results from in the last article.
To spoil the punchline up front, the worst case I called out in part 1 (Gemma 3 27B with 16 in-flight requests each carrying distinct steering configs, +22% end-to-end latency vs the disabled baseline) is now +2.7% on the same configuration. Per-token cost on 27B went from +4.8–9.4% to +0.0 ± 0.0 ms on enabled_idle and named_shared, and +1.3% worst case on per_request_n16. The full benchmark tables are in the Final benchmarks section at the bottom.
Let’s start with reviewing the optimization roadmap that I ended with last time:`
- Optimize config registration to further reduce per request overhead, the dominant remaining overhead at larger batch sizes and short workloads
- Name to vector resolution should happen on the worker side
- Write a custom Triton kernel for indexed scatter to steering tables
All three got done, but they were only the start. Profiling once you remove an obvious bottleneck reveals the next one. The biggest win in this post (binary wire format for inline vectors) wasn’t on the original roadmap at all, because the bottleneck it addresses was hidden under three other ones until those were cleared.
Optimizations
Config registration
Config registration itself (SteeringManager.register_config) which gets called when a new (hash, phase) config is admitted I was able to pretty simply batch into a single non-blocking H2D transfer instead of the previous approach that was a different cudaMemcpy for every (layer, hook) combination.
for hook_point, layer_vecs in vectors.items():
    items = [
        (layer_idx, vec)
        for layer_idx, vec in layer_vecs.items()
        if locally_owned_layers is None or layer_idx in locally_owned_layers
    ]
    if not items:
        stored[hook_point] = {}
        continue
    layer_idxs = [layer_idx for layer_idx, _ in items]
    raw_vecs = [vec for _, vec in items]

    arr = np.asarray(raw_vecs, dtype=np.float32)
    cpu_t = torch.from_numpy(arr).pin_memory()
    stacked = cpu_t.to(self.device, non_blocking=True)

    stored[hook_point] = {
        layer_idx: stacked[i : i + 1] for i, layer_idx in enumerate(layer_idxs)
    }

self.config_vectors[key] = stored
The pin_memory() + non_blocking=True pair is what’s actually doing the work here. The previous code path went through torch.tensor(vec, device="cuda") for each (layer, hook) pair, which issues a synchronous cudaMemcpy per row. Stacking on the CPU first and shipping one pinned non-blocking copy collapses ~80 syncs down to one per hook. The microbench for the steering manager showed a 1.86–1.93× speedup:
| layers / configs / hooks | baseline | new | speedup |
|---|---|---|---|
| 26 / 1 / 1_hook | 3.46 ms | 1.79 ms | 1.93× |
| 26 / 16 / 3_hooks | 162.2 ms | 87.1 ms | 1.86× |
| 34 / 16 / 3_hooks | 212.2 ms | 113.9 ms | 1.86× |
| 42 / 16 / 3_hooks | 263.0 ms | 140.9 ms | 1.87× |
That seemed like the win until I profiled it again later in the project and found another ~16 ms hiding in the pin_memory() call itself. The non_blocking=True on the H2D doesn’t hide the host-side page-lock + copy that pin_memory() performs. Non_blocking means “don’t block on the GPU side”, not “don’t block on the host side”. So we’re still synchronously locking and copying ~2 MB of host memory per call before the async H2D can be enqueued.
The fix is a reusable pinned-CPU staging ring: 4 slots, each growable up to a 32 MB cap, each paired with a cuda.Event recorded immediately after its async H2D is enqueued. A slot is only reused after its event has fired, so successive calls cannot corrupt earlier in-flight transfers. The H2D is queued on the current default stream and the function returns the device tensor immediately. populate_steering_tables (the only consumer) runs on the same stream, so in-stream ordering provides the implicit “deferred sync” without needing an explicit wait_event.
| mode | stack_vectors_to_device wall |
|---|---|
named_shared | 16.2 ms / 5 calls |
all_steered_shared | 16.7 ms / 9 calls |
per_request_n4 | 19.0 ms / 16 calls |
Another change made to the registration process was something I feel a bit silly for needing to do in the first place, using numpy arrays instead of lists of floats in
the vector resolution and config hashing parts of this path. The prior code re-converted the resolved list back to an ndarray inside hash_steering_config via np.asarray(vec, dtype=np.float32).tobytes() once per layer on the hot path, twice per request (prefill + decode). Pushing ndarrays through end-to-end skips the per-layer conversion entirely while keeping the hash bit-identical. The benchmarks show:
hash_steering_config - uniform 7.7–8.3× across the sweep
| layers / hooks / overlap | baseline | new | speedup |
|---|---|---|---|
| 26 / 3_hooks / base_only | 5.53 ms | 0.71 ms | 7.78× |
| 34 / 3_hooks / base_plus_phase | 7.54 ms | 0.93 ms | 8.13× |
| 42 / 1_hook / base_plus_phase | 3.00 ms | 0.38 ms | 7.84× |
| 42 / 3_hooks / base_only | 9.53 ms | 1.14 ms | 8.34× |
resolve_effective_vectors - 1.13–1.63× when there’s a merge
| layers / hooks / overlap | baseline | new | speedup |
|---|---|---|---|
| 34 / 3_hooks / base_plus_phase | 20.58 ms | 13.27 ms | 1.55× |
| 42 / 3_hooks / base_plus_phase | 26.74 ms | 16.45 ms | 1.63× |
| 34 / 1_hook / base_plus_phase | 6.37 ms | 4.39 ms | 1.45× |
| 26 / 1_hook / base_only | 1.61 ms | 1.64 ms | 0.98× |
Combined per-request savings (34-layer / 3-hooks / base+phase)
| stage | baseline | new | saved |
|---|---|---|---|
| resolve (× 1) | 20.58 ms | 13.27 ms | 7.31 ms |
| hash (× 2, prefill + decode) | 15.08 ms | 1.86 ms | 13.22 ms |
| total | 35.66 ms | 15.13 ms | 20.53 ms saved per request |
Steering table/index building
This isn’t strictly config registration, but the same per-config bookkeeping shows up again on the per-step populate path, and the wins there compound with the registration ones.
One of the more significant changes was something that I mentioned in the previous post, which I erroneously thought that I would need a triton kernel for but ended up being able to do with regular pytorch code. This is the consolidation of the steering tables into a contiguous tensor that gets copied to the GPU in one go. The work done here is called on every decode step, so bringing this down is important.
The code I actually used to do this is a bit verbose for putting in a blog post, but the basic idea is: order the configs by layer and by hook point within the layers, build a list of tensors that respects the ordering, use torch.stack(flat_rows).reshape(len(active_tables), num_rows, hidden_size) to create the contiguous tensor, move it to the GPU in one go, and then build the steering index to target this new format. The benchmarks for this showed very nice gains on the populate_steering_tables path:
| layers / configs / hooks | baseline | new | speedup |
|---|---|---|---|
| 26 / 1 / 3_hooks | 1.64 ms | 0.83 ms | 1.97× |
| 26 / 16 / 3_hooks | 3.40 ms | 2.72 ms | 1.25× |
| 34 / 8 / 3_hooks | 3.16 ms | 2.08 ms | 1.52× |
| 42 / 1 / 3_hooks | 2.56 ms | 1.31 ms | 1.96× |
| 42 / 16 / 3_hooks | 5.46 ms | 4.26 ms | 1.28× |
Building the steering index had a similar optimization path, replacing the per-request slice-assign loop with a single np.repeat that expands the per-request rows into the per-token row array, then copies it in a single non-blocking H2D transfer:
expanded = np.repeat(
    rows_scratch[:active_count],
    n_tokens_scratch[:active_count],
)
n_expanded = int(expanded.shape[0])
n_expanded = min(n_expanded, index_pinned.shape[0], steering_index.shape[0])

index_pinned[:n_expanded].copy_(torch.from_numpy(expanded[:n_expanded]))
steering_index[:n_expanded].copy_(
    index_pinned[:n_expanded], non_blocking=True
)
The benchmarks here were even better than the steering table population, with the caveat that the np.repeat + pinned-copy path has fixed setup cost that doesn’t amortize at batch size 1. There, the old per-element write into a single GPU slot was actually cheaper. I’m generally chasing speedups on configurations that resemble production workloads, so this is an acceptable tradeoff when the mixed steered/unsteered batch-size-16 path has a 3× improvement:
| scenario | num_reqs × tokens | baseline | new | speedup |
|---|---|---|---|---|
| decode_128 | 128 × 1 | 0.910 ms | 0.110 ms | 8.36× |
| decode_64 | 64 × 1 | 0.467 ms | 0.070 ms | 6.70× |
| decode_32 | 32 × 1 | 0.237 ms | 0.052 ms | 4.63× |
| decode_8 | 8 × 1 | 0.070 ms | 0.037 ms | 1.90× |
| mixed_16 | 1×256 + 15×1 | 0.128 ms | 0.042 ms | 3.07× |
| decode_1 | 1 × 1 | 0.017 ms | 0.033 ms | 0.53× ↓ |
| prefill_1×1024 | 1 × 1024 | 0.017 ms | 0.033 ms | 0.53× ↓ |
There was another win on the populate path that came from an observation I missed in part 1: when a user only registers, say, post_mlp vectors and leaves pre_attn and post_attn fully zero, the inactive hooks were paying full table-gather + dtype-cast per token per layer. The fix is a per-hook bool[1] buffer alongside each table that says whether any row in that table is nonzero. apply_steering and the Triton kernel read it: when zero, the kernel skips the table gather + cast and just memcpys hidden_states to the fresh output. The CPU eager path short-circuits to hidden_states.clone() directly.
The trick worth mentioning is that the flag has to be a tensor, not a Python branch. torch.compile traces a tensor read as static graph topology but a Python if on the active-set would force a recompile every time the active hooks change. So you read a 1-byte tensor every step and let the kernel decide what to do with it. Branch on data, not on Python.
Named vector resolution
The named vector support was initially added as a UX feature to make constructing requests for vectors that you know ahead of time and intend to reuse regularly, as well as to lower the amount of bytes over the wire when you’re repeatedly sending requests that include it. It turns out to also short-circuit the entire config registration path on the worker. If the same vectors are going to be reused across many requests, you only need to pay the registration cost once and then every request that references the name skips it.
To recap, the problem here was that originally I was resolving the vectors from the names passed by a request as part of the OpenAI serving handlers and storing the registry table on the server side. This meant that ultimately the actual IPC traffic sent from the server to the workers was the same as if the named vectors weren’t used at all. Like I said earlier, this feature was originally conceived as a UX improvement not a performance optimization. By reframing it as an important way to sidestep the config registration path and lower the traffic that a worker has to receive for vectors that are repeatedly reused, we can save a lot of overhead.
The basic way of handling this is: make a worker side _steering_module_registry, populate it with engine_client.collective_rpc, and only pay the cost of registration once instead of every time a vector is sent.
The worker-side named resolution from the section above sidesteps re-shipping vectors over IPC, but it didn’t sidestep re-resolving them. Every request still ran merge_steering_specs + resolve_effective_vectors on the worker, per phase, even when every request in the batch had the same steering_module_ref=(name, scale). Profiling gemma-3-4b-it at BS=8 with 3 active hooks showed ~73 ms/generate of host-side stalls just doing that work over and over, with the numpy cost scaling roughly linearly with hook count.
The fix is dumb in hindsight: pre-resolve each named module’s prefill and decode specs once at register_steering_modules time and store them. _resolve_request_steering returns the cached spec for scale=1.0, multiplies once for scale != 1.0, and only falls through to the existing path when there are inline overrides on top of the module ref.
The microbench shows that the not only do these changes cut almost the entire remaining per-request overhead, but it removes the fixed cost that previously scaled with num_layers and num_hook_points:
| layers / hooks | baseline RT (inline) | new RT (module_ref) | speedup | bytes (base → new) |
|---|---|---|---|---|
| 26 / 1_hook | 7.02 ms | 0.010 ms | 676× | 599 583 → 214 |
| 26 / 3_hooks | 22.15 ms | 0.011 ms | 2 096× | 1 798 377 → 214 |
| 34 / 1_hook | 9.06 ms | 0.010 ms | 867× | 784 001 → 214 |
| 34 / 3_hooks | 28.89 ms | 0.011 ms | 2 740× | 2 351 649 → 214 |
| 42 / 3_hooks | 37.43 ms | 0.011 ms | 3 548× | 2 904 930 → 214 |
There was one more remaining cost on the named path: even after pre-resolving, the device-side row and H2D were lazy and the cost was paid on the first request that resolved to that name. On gemma-3-4b-it in named_shared mode that first call cost ~15 ms of stacked bf16 H2D for 34 layers × hidden_size on the critical path of request 1, then ~5 μs refcount-hits thereafter. The fix is to allocate the row and ship the H2D at register_steering_modules time rather than waiting for the first request that needs it. Two new worker RPCs (pre_materialize_steering_module and the matching release) bump refcount +1 per (hash, phase) and pin the row when the module gets registered; the unregister path drops the pin before clearing the registry entry. The first request that lands then finds the row already populated and gets the refcount-hit path immediately.
Packing inline vectors in model dtype
Not everyone can use named modules, especially research workloads that are iterating over a lot of different steering configurations to find the right mediator that affects behavior. The inline path (no module ref, just raw vectors per request) was still shipping fp32 list[float] over the IPC boundary encoded as msgpack. At the bench shape (~2.3 MB per request) the IPC submission alone took ~290 ms going from 1 to 3 hooks. Compared to the named path that’s pretty bad.
Two changes here. First, move the resolve from the worker to the client so the worker just unpacks bytes instead of running merge/resolve. Second, pack the resolved vectors in the model’s compute dtype before crossing the multiprocessing boundary. Wire format becomes dtype-tagged raw bytes via msgspec’s enc_hook. At fp32 that’s a ~2.25× wire reduction over the old list[float] encoding, at fp16 it’s ~4.5×. bf16 falls back to fp32 because numpy doesn’t have a native bf16, but the worker reinterprets the bytes correctly on the other side.
The tricky part is hash determinism. The fp32-packed bytes have to hash to the same prefix-cache key as the unpacked-and-re-resolved fp64 vectors, otherwise the same logical request would miss the prefix cache after the format change. So the client primes the hash against the fp64-resolved vectors before packing, which keeps the cache key stable.
| config | inline before | inline after | Δ |
|---|---|---|---|
| 1_hook | 1631 ms | 1517 ms | -114 |
| 3_hooks | 1924 ms | 1567 ms | -357 |
The 1→3 hooks delta dropped from +293 ms to +50 ms (+3.3%). Not flat like the named path, but close.
Binary wire format for inline vectors
The pack-in-dtype change made the bytes smaller, but it left the request body wrapped in msgspec. That meant the API-server thread still parsed it as a normal OpenAI completions request: uvicorn deserialized JSON, pydantic walked the schema, and np.asarray(list_of_floats) ran three more times (in resolve, in hash, and in pack). At the bench shape that’s ~5–10 ms of uvicorn + pydantic + Python float-object materialization (~87,000 float objects per request), then another ~5–10 ms across the three ndarray-construction sites. Both block the asyncio event loop, which means concurrent inline requests serialize on the API server even though the work itself is per-request-independent.
This is what I missed all the way back in part 1 when I assumed the per-request submission cost was about IPC bandwidth. It wasn’t. It was about how expensive it is for Python to parse 87,000 floats out of JSON and turn them into ndarrays. Part of why this took me so long to find is that most of my early profiling was driven by scripts calling vllm.LLM directly while the latency and throughput benchmarks I was chasing were against the OpenAI HTTP server. The Python API skips uvicorn, pydantic, and the JSON parse entirely, so the cost that actually dominates real serving traffic was literally not present in the path I was profiling. Once I lined up the profile with the benchmark and started instrumenting the OpenAI server side, it was obvious (and embarrassing) in hindsight. Three other branches I tried (zstd, shared-memory IPC, fire-and-forget broadcast) targeted IPC and got nothing for it because they were also fighting the wrong part of the stack.
The fix is to give the API a binary path: send each hook as a base64-encoded blob containing a stacked (num_layers, hidden_size) array, with a small JSON header carrying dtype + shape + layer_indices. Decode on the server is base64.b64decode + np.frombuffer, which is zero-copy and microsecond-scale. The downstream resolver and hasher already accept ndarrays, so the packed form skips the entire parse and ndarray-construction tax.
{
  "steering_vectors": {
    "post_mlp": {
      "dtype": "float32",
      "shape": [34, 2560],
      "layer_indices": [0, 1, 2, "...", 33],
      "data": "<base64-encoded contiguous bytes>"
    }
  }
}
The list-of-floats form still works. When both are set, the packed field wins, so clients can migrate per-field. Hash determinism stays bit-exact because both paths feed the same arr.tobytes() into the hasher.
Numbers on a pinned-clock 3090 (gemma-3-4b-it, n=128 prompts, concurrency=8, max_tokens=128, prompt_len=256, drained warmup):
| mode | TTFT median: base → binary | TTFT p99: base → binary | Throughput Δ |
|---|---|---|---|
all_steered_shared | 305.8 → 63.9 ms (−79%) | 508.7 → 80.5 ms (−84%) | +30% |
per_request_n4 | 314.0 → 64.7 ms (−79%) | 506.2 → 85.6 ms (−83%) | +24% |
per_request_n16 | 224.7 → 52.4 ms (−77%) | 541.4 → 124.7 ms (−77%) | +22% |
This is the single biggest win in this entire post. Inline modes now sit within 2–4% of the enabled_idle throughput floor and within 9–22 ms of its TTFT. That promotes inline from “use named_shared if you can” workaround to a viable production path, which matters because research workloads can’t use named modules. They’re iterating across distinct configs every batch.
TPOT is flat across all modes (within ±0.4 ms). The savings are entirely on the request-preparation host path; nothing changes per decode step.
A small follow-up brings the binary path to feature parity with the legacy form: an optional scales: list[float] field on each hook, length-checked against layer_indices. When omitted, decode stays zero-copy. When present, each row is multiplied by dtype.type(scales[i]) (using the dtype’s scalar type, not a bare Python float, so the result stays in source dtype instead of NumPy-promoting to fp64). This matters for the use case where the same vector bytes get reused at different scales across requests. Re-encoding the ~350 KB blob per scale change would defeat the wire-format win.
Land, fix, remove: auto-promote
Before the binary wire format was in, the cheapest way I had to handle repeated inline specs in a batch was to auto-register them as named modules behind the user’s back. When the same steering spec arrived in N consecutive requests, the second arrival would register an anonymous module (hash-derived name) and rewrite subsequent requests to steering_module_ref=(name, 1.0). The full spec ships once; the next N–1 requests with the same spec ship 16 bytes instead of the ~520 KB packed blob.
The first sighting just records because otherwise a research-style unique-per-request workload would pay a wasted synchronous collective_rpc per request. Only the second sighting promotes. The numbers were real at the time:
| config | feat/steering | with auto-promote | Δ |
|---|---|---|---|
| 1_hook inline | 1517 ms | 1502 ms | −15 |
| 3_hook inline | 1567 ms | 1510 ms | −57 |
Wall delta 1→3 hooks (inline): +50 ms → +8 ms. Inline matched named within ~1 ms on shared-spec workloads.
Two stories from this branch worth telling. The first is a hash-stability bug I shipped without realizing it. Auto-promote is supposed to be transport-only: register the spec under a worker-side name, leave the request identity (= the inline-content hash) unchanged. But the merged implementation inadvertently folded the auto-generated _auto_<hex> module_ref into the request hash. So the first request in a shared-[sp]*N batch (still inline, hash H_inline) and its siblings (now module-ref’d, hash H_module) ended up with different hashes for the same logical config. That doubled the (hash, phase) row count the strict-capacity table had to hold; running with max_steering_configs sized close to steady-state crashed on the first prefill→decode transition with “No free steering table rows”. The fix was to recover the original hashes from the auto-generated name (which is just hex-encoded versions of them, so the round-trip is exact) and short-circuit the hash path back to those.
The second story is the more interesting one. Once the binary wire format above landed, the median benefit of auto-promote collapsed to noise (inline TTFT was now ~60 ms instead of ~250 ms) but the costs auto-promote added per-request didn’t shrink. Every inline request was paying a SteeringAutoPromoteLRU lookup on the API-server thread to decide whether the spec was a second sighting, which adds per-request CPU on the asyncio event loop whether or not promotion fires. The branches that do promote then pay a synchronous collective_rpc(register_steering_modules) broadcast on the triggering request’s critical path. On per_request_n16 with 16 distinct configs in 128 requests, those 16 broadcast calls formed a slow cohort that was 12.5% of the workload. They landed exactly at p87–p100 and stretched the tail by ~36 ms. Three trials each, very reproducible:
| variant | p99 (3 trials, ms) | mean ± stdev |
|---|---|---|
| AP sync (the merged path) | 127.8, 129.4, 125.1 | 127.4 ± 2.2 |
| AP async (fire-and-forget) | 154.9, 143.4, 138.4 | 145.6 ± 8.5 |
| AP off (just delete it) | 87.8, 87.8, 89.8 | 88.5 ± 1.1 |
The async variant was supposed to move the broadcast off the critical path by dispatching it as a background asyncio.Task instead of awaiting it inline. The cost moved but didn’t shrink and p99 actually got worse. Removing the mechanism outright wins on every axis: median flat, p99 −36 ms, throughput +1.6%, structural bimodality eliminated. Net diff was +5 / −959 lines.
The lesson I’ll take from this is that optimizations which ride on a measured cost should expect to be removed when that cost moves. Auto-promote was a defensible local optimum given the inline-JSON cost structure when I shipped it. Once binary wire restructured what “inline” meant, the right move was the deletion, not the salvage attempt. Keeping it around “just in case” would have grown surface area and the p99 tail without buying anything.
Gather-add Fused Kernel
The indexed gather that pulls steering configs out of the table and the residual add that applies them used to be two separate ops. Normally torch.compile would fuse them automatically, but apply_steering is registered as an opaque custom op so Inductor can’t see inside.
It has to be opaque because the steering table is initialized to zeros. If Inductor could trace hidden + table[index] at compile time it would see every entry as zero and constant-fold the whole op away. The table gets populated later when configs load, but by then Inductor has already decided steering is a no-op and removed it from the graph. So we hide the body behind an opaque op and fuse it ourselves with a Triton kernel.
The win is bandwidth, not launch overhead. The unfused body records two kernel launches into the captured CUDA graph:
aten::index_select :  read table[index] rows, write temp  →  2·N·D bytes
aten::add          :  read hidden, read temp, write out   →  3·N·D bytes
                                                              ─────────
                                                              5·N·D bytes HBM
The fused kernel records one:
apply_steering : read hidden, gather table[index], write out → 3·N·D bytesA ~40% drop on the steering op: the unfused path materializes a [N, D] temp tensor and immediately re-reads it, while the kernel streams hidden_states once and writes the sum back in a single pass. Graph capture doesn’t change this. It eliminates CPU-side launch coordination but it doesn’t fuse kernels or elide intermediates, so the temp still flows through HBM at every replay.
End-to-end the win is about 1% of wall-clock, because steering is a few-MB op inside a multi-GB-per-replay graph. But it’s a simple kernel with minimal room for correctness issues, and the eager path (enforce_eager=True, graph-break fallbacks) gets a much larger win, 1.3× geomean and ~2× at N=2048 in the microbench. The core of the kernel:
pid_n = tl.program_id(axis=0)

row = tl.load(index_ptr + pid_n)

hidden_row_ptr = hidden_ptr + pid_n * h_stride_n
table_row_ptr  = table_ptr  + row   * t_stride_r
out_row_ptr    = out_ptr    + pid_n * o_stride_n

for h_off in range(0, H, BLOCK_H):
    h_idx = h_off + tl.arange(0, BLOCK_H)
    mask = h_idx < H
    h_vals = tl.load(hidden_row_ptr + h_idx * h_stride_h, mask=mask)
    t_vals = tl.load(table_row_ptr  + h_idx * t_stride_h, mask=mask)

    result = h_vals + t_vals.to(h_vals.dtype)
    tl.store(out_row_ptr + h_idx * o_stride_h, result, mask=mask)
Plus BLOCK_H tuning and a warmup pass ahead of graph capture so the JIT cost is frontloaded rather than baked into a captured graph.
Nsight Systems caught a follow-up here that I was about to ship without. Even after the warmup, the kernel was still JIT-compiling two distinct variants at runtime. Each a ~10 ms cuLibraryLoadData event firing inside served request windows. Identical timings across every served mode, including enabled_idle which never applies a non-zero vector. The existing warmup only touched N=1; the runtime path hit other batch dims that didn’t share specialization. The fix is to drive the warmup through the registered torch.ops.vllm.apply_steering op (not the Triton wrapper directly) at every entry in vllm_config.compilation_config.cudagraph_capture_sizes, exercising both any_active states per shape so the stride specialization matches what the runtime call triggers. JIT compiles now happen during the same prep window as CUDA-graph capture; cuLibraryLoadData drops to 0 in the served window.
A profiling surprise
One discovery I wasn’t expecting: even when the engine was started without --enable-steering, the steering kernel was launching every forward step. The profile showed ~20k _apply_steering_kernel launches per ~250-step run, which is ~40 ms / 1.8% of forward CUDA time. Two unguarded paths were responsible. First, register_steering_buffers always allocated 3 sentinel rows regardless of whether steering was on. Second, apply_layer_steering dispatched the kernel unconditionally.
The fix is to early-return from register_steering_buffers when max_steering_configs == 0, and to gate apply_layer_steering on a hasattr(module, table_attr) check that’s decided once at __init__. torch.compile traces the hasattr as a static branch, so the kernel literally doesn’t appear in the captured graph when steering is disabled. Same branch-on-data trick as the any_active flag, just applied to a coarser binary.
Result was a 7% per-step median improvement in disabled mode and no change in enabled mode. This is one of those cases where the optimization was invisible until profiled. Nothing in the test suite would have caught it, because everything was correct. The kernel was just doing pointless work on every forward.
Parallelism
Tensor and pipeline parallelism work without modification. The residual stream is full-hidden on every TP rank — sharding happens inside attention and MLP and is collapsed by the row-parallel all-reduce before the next residual write — so the steering tables are replicated rather than sharded, and the apply is a pointwise indexed-add. Row IDs are derived deterministically from the same broadcast on every rank, so there are no collectives in the hot path. The post_mlp hook lands after the MLP down-projection, so expert parallelism falls out for free too.
Final benchmarks
3090 comparisons
First I want to show a striking result that directly compares the plots from the part 1 to plots generated using the same script on the same hardware. As you can see in the plots below, the optimizations made in part 2 completely remove the throughput cost scaling with proportion of the batch that is being steered! It even removes the cost vs having steering disabled.
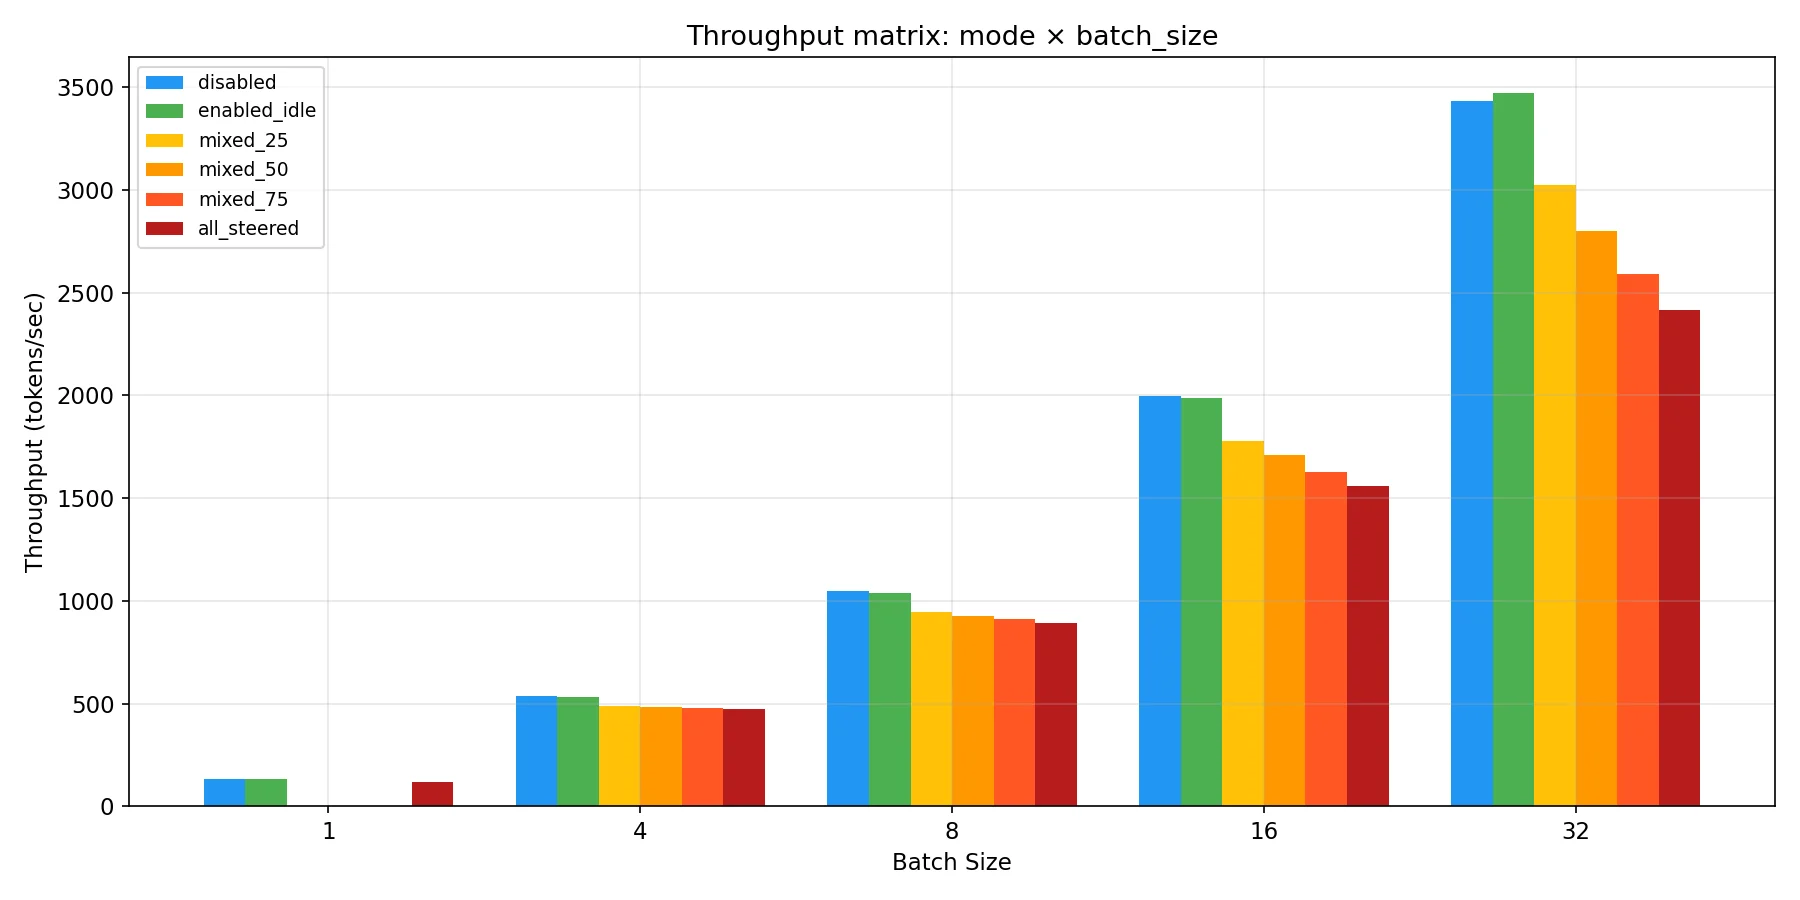
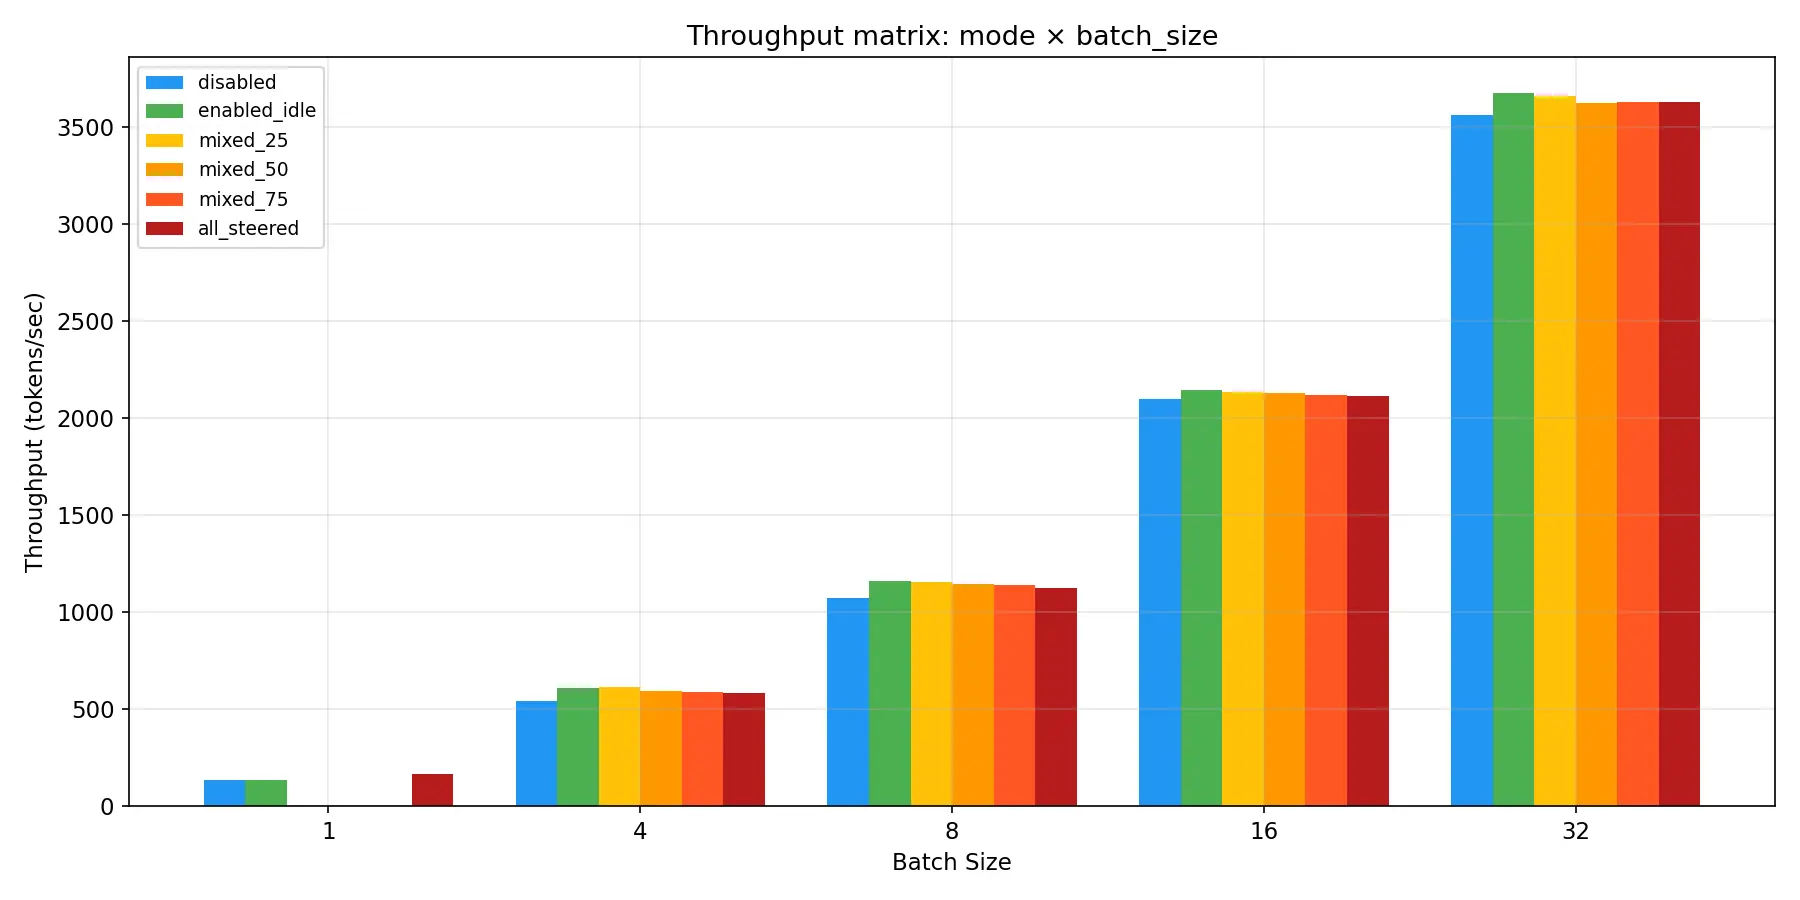
I should point out though that as I mentioned before, all but the serving benchmarks are generated using scripts that directly import vLLM and use it as a python interface. I wanted to keep this the same as before so that the data was directly comparable to what was generated in part 1, but it’s important to note that having zero overhead vs disabled doesn’t entirely hold up when running the serving benchmarks that use the OpenAI API as they would in a production workload. This is okay though, because as you’ll see in the next section on the A100 benchmarks even that is significantly reduced in this round of optimizations!
A100 benchmarks
I rented an A100 80GB to validate everything against the same workload shapes the part 1 H100 numbers used. H100s were hard to find during the rebench window (supply is tight right now) so the production-scale validation is on A100 this time. I did find an H100 on Vast.ai but they didn’t give me the permissions I needed to pin the GPU clock to avoid thermal throttling messing with the numbers and Prime Intellect did, so I chose to go with an A100 on their platform instead.
The configuration mirrors part 1: Gemma 3 4B and 27B, 64–128 prompts at concurrency 8–16, vs-disabled deltas reported as mean of per-trial medians ± SEM with * marking deltas above 2× the combined SE. Pinned clock at 1410 MHz, native PyTorch sampler.
The headline comparison is on per_request_n16 (16 in-flight requests each with a distinct steering config), the worst-case workload from part 1. Numbers below are E2EL overhead vs the same model’s disabled baseline at max_tokens=256 to match part 1’s setup.
| model | part 1 (H100) | part 2 (A100) | reduction |
|---|---|---|---|
| 4B | +7% | +7.8% | flat (already amortized at max_tok=256) |
| 27B | +22% | +2.7% | 8× |
The 4B comparison is roughly flat because at max_tokens=256 the part 1 number was already amortized down by per-token cost (which on 4B is small enough that fixed TTFT cost dominates). The 27B comparison is where this whole project lived: the per-request submission cost that part 1 called “the cost to beat” is now flat enough that the TTFT hit doesn’t blow up E2EL anymore.
The full per-mode breakdown on A100 (vs each model’s disabled baseline):
| mode | ΔTTFT: 4B | ΔTTFT: 27B | ΔTPOT: 4B | ΔTPOT: 27B | ΔE2EL: 4B | ΔE2EL: 27B |
|---|---|---|---|---|---|---|
| enabled_idle | -1.3 ms (-4.2%) | -6.6 ms (-5.9%) | +0.2 ms (+2.8%) | +0.0 ms (+0.0%) | +2.4%* | -0.1% |
| named_shared | +0.0 ms (+0.0%) | +0.1 ms (+0.1%) | +0.2 ms (+2.8%) | +0.0 ms (+0.0%) | +2.5%* | +0.0% |
| all_steered_shared | +11.8 ms (+37.8%) | +50.5 ms (+45.5%) | +0.3 ms (+4.2%) | +0.2 ms (+0.5%) | +5.4%* | +1.7%* |
| per_request_n4 | +16.0 ms (+51.2%) | +60.4 ms (+54.4%) | +0.3 ms (+4.2%) | +0.2 ms (+0.5%) | +6.3%* | +1.9%* |
| per_request_n16 | +17.6 ms (+56.3%) | +70.7 ms (+63.7%) | +0.4 ms (+5.6%) | +0.5 ms (+1.3%) | +7.8%* | +2.7%* |
4B Baseline (N=18): TTFT 31.25 ms | TPOT 7.189 ms | E2EL 944 ms
27B Baseline (N=5): TTFT 110.95 ms | TPOT 37.435 ms | E2EL 4865 ms
Three things this says about the runtime:
enabled_idle and named_shared add zero measurable TPOT on 27B (0.0 ± 0.0 ms) and ~0.2 ms/tok on 4B. Loading the steering scaffold, or sending requests that reference a pre-registered named module, is free at production model scale on every metric that matters. This was the design goal in part 1, and on production hardware with the optimizations applied, it’s literally free.
Per-request inline modes have a real TTFT cost that scales with model size in absolute ms (~12-18 ms at 4B, ~50-70 ms at 27B), but shrinks as a fraction of E2EL because larger per-token compute dilutes the prefill cost. The 27B worst-case is bounded at +2.7% E2EL.
TPOT is mode-flat across both models. Worst-case TPOT delta is +0.4 ms on 4B (+5.6%) and +0.5 ms on 27B (+1.3%). The steering tax is paid at prefill, not at decode, which is the right shape for steering to have, because most workloads decode much longer than they prefill.
The max-tokens sweep (4B, per_request_n16 vs disabled) shows the amortization story cleanly:
| max_tokens | ΔTTFT (abs) | ΔTPOT | ΔE2EL |
|---|---|---|---|
| 64 | +33 ms | +11.3% | +17.3% |
| 128 | +32 ms | +6.7% | +9.7% |
| 256 | +24 ms | +4.1% | +5.6% |
| 512 | +27 ms | +2.2% | +3.0% |
| 1024 | +27 ms | +2.7% | +2.7% |
| 2048 | +33 ms | +1.4% | +1.7% |
ΔTTFT is essentially constant at ~30 ms since TTFT is a one-shot prefill cost that doesn’t depend on output length. ΔTPOT and ΔE2EL halve roughly every doubling of max_tokens and saturate near ~2% at long outputs. By max_tokens=2048 even the worst-case 4B configuration has E2EL overhead within 1.7% of disabled.
Last thing to validate: CUDA graphs still capture cleanly under heavy heterogeneous steering load. This was load-bearing for the whole design in part 1. Every “no conditionals, opaque custom ops, statically sized buffers” decision was in service of keeping graphs intact, and if they’d stopped being captured the numbers above wouldn’t mean anything. Same 4B serving configuration, two server launches per trial, one with default graph capture and one with --enforce-eager:
| mode | E2EL graphs | E2EL eager | speedup |
|---|---|---|---|
| disabled | 956 ms | 5810 ms | 6.08× |
| enabled_idle | 969 ms | 6611 ms | 6.82× |
| named_shared | 969 ms | 6609 ms | 6.82× |
| all_steered_shared | 1029 ms | 6659 ms | 6.47× |
| per_request_n4 | 1031 ms | 6690 ms | 6.49× |
| per_request_n16 | 1047 ms | 6715 ms | 6.41× |
Graphs are ~6.5× faster than eager across every mode, including the worst case. Per-token impact is the dramatic part: TPOT with graphs is ~7.4–7.7 ms; TPOT without graphs is ~50–51 ms. The runtime captures graphs cleanly under all steering loads, and steering takes its share of the graph benefit.
The vs-disabled overhead I called “the thing I don’t want to soften” in part 1 went from +22% to +2.7% on 27B, with graphs intact, TPOT flat, and enabled_idle literally free. I’m pretty happy with where this landed.
Things I tried that didn’t pay off
For honesty’s sake, a handful of things I tried alongside the wins above that ended up closed without merging. Each was a reasonable hypothesis on paper:
- zstd-compressing the packed inline vectors over IPC - Predicted ~30 ms/request on the assumption IPC bandwidth was the bottleneck. Bench showed a 15–64 ms regression on every shape. On a single-host loopback ZMQ deployment with PCIe 4.0, a 520 KB transfer takes ~17 μs, while zstd compress+decompress costs ~5–10 ms per request. The msgspec dict walk dominated the cost, not zstd, so a cheaper compressor wouldn’t have saved it either.
- Shared-memory IPC - Client mmaps a region, ships only
(offset, length, dtype, shape)(~32 bytes per layer) instead of the packed blob. Came out flat (±9 ms) on every benched shape, because once the inline-pack PR shrank the payload to model dtype, the residual per-request overhead was hash + msgspec walk + worker-side resolve, none of which mmap touches. - Fire-and-forget auto-promote broadcast - covered in the auto-promote section above. The cost moved off the triggering request but didn’t shrink; p99 got worse, not better. Closed in favor of removing auto-promote entirely once binary wire made the underlying motivation moot.
- Fused per-layer
index_copy_in populate - 34 sequential ~80 μs launches per scatter was the trace observation. Lazily allocating one contiguous[L, R, H]backing tensor per (hook, dtype) group and rebinding each per-layer table buffer to a view viaTensor.set_would collapse it to one launch per group. Overlapped with the async H2D ring and the prematerialize PR on the same file though, and the wins those landed shrank the budget this was claiming. - In-place
apply_steering-mutates_args=["hidden_states"]to halve per-call bandwidth (skip the fresh output allocation). Didn’t land, the any-active short-circuit PR landed instead and partially subsumed the gain. - Autotuning the steering Triton kernel over a few
BLOCK_H/num_warpsconfigs - Didn’t beat the hand-picked heuristic enough to be worth the cache-key complexity. - int16
steering_indexto quarter the per-gather index bandwidth - Cappedmax_steering_configsat 32764, cast to int32 inside the kernel before stride math. Real but small win, and not net-positive enough to justify the new admission-time guard. - Fusing PRE_ATTN + POST_ATTN into one kernel for gemma3 - Drops 28 launches per forward. Closed in favor of broader cross-model work like the any-active short-circuit, which gets most of the value without the per-model surgery.
- Fusing
apply_steeringwith the followingGemmaRMSNorm- used my own RMSNorm triton kernel which gave up a lot of the performance of the vLLM finely honed CUDA kernel.
The pattern I keep landing on is that anything trying to be clever about IPC, on a single-host loopback ZMQ deployment with PCIe 4.0, is solving the wrong problem. The actual residual cost on the inline path was Python JSON parsing and ndarray construction running on the asyncio event loop. Binary wire format addressed that directly and erased ~80% of inline TTFT in one shot. If you find yourself reaching for compression or shm, profile the host side first.
Activation capture & consumer plugin system
Another part of this project that I’ve been working on is a capture subsystem that lets you pull the same residual-stream activations the steering path writes to, and route them to user-defined consumers. Originally I built it just to dump activations to an NFS volume so I could train SAEs and feature classifiers on production speed traffic. Once the plumbing existed it was straightforward to generalize the consumer side into a plugin interface, which can be used to calculate and return reward signals that are calculated from activations.
The system is shaped around three decisions that came out of building it for a real workload.
Consumers are advertised under the vllm.capture_consumers Python entry-point group. The built-in ones look like this:
[project.entry-points."vllm.capture_consumers"]
logging = "vllm.v1.capture.consumers.logging:LoggingConsumer"
filesystem = "vllm.v1.capture.consumers.filesystem:FilesystemConsumer"
A third-party package declares its own consumer under the same group, gets installed in the same env, and the engine picks it up by name without me having to know about it ahead of time. Engine-side config is CaptureConsumersConfig(consumers=[CaptureConsumerSpec(name, instance_name, params)]), with a CLI shorthand name:key=val,key=val. Per-request opt-in is sampling_params.capture[consumer_name] = raw_spec and each consumer validates its own request shape, so an invalid shape becomes HTTP 400 directly. Consumers can also declare a global_capture_spec() that fires on every request, which is what the filesystem consumer uses to record activations whether or not the client knew about it.
A consumer declares location = "worker" or location = "driver" as a class attribute. Worker consumers run on every TP/PP rank and see chunks streamed directly from the side stream, which is the right shape for filesystem writers where each rank writes its own shard. Driver consumers run once on the driver process and receive chunks bridged across torch.multiprocessing.Queue (not multiprocessing.Queue, since CUDA shared-memory tensors only transfer correctly through the torch version). The bridge reuses the same batched-adapter shape and ships CaptureResult back over a paired result queue. Driver location is the right shape for the reward-signal use case, where you want to compute one number per request from the union of all ranks’ captures and then attach it to the RequestOutput.
Capture fires on the unmodified residual, before steering applies. This is crucial for the dynamic steering use case I care about. Two requests that share a prompt but carry different steering vectors should produce identical captures, because what you want to study is the model’s behavior on the prompt, not the model’s behavior on the prompt-plus-your-intervention. The capture hook is placed in the layer before apply_layer_steering, so the steered tensor never feeds the capture path. The training data this produces is therefore safe to mix across different steering configs in a single dataset, which is a property that would not hold if capture ran after steering.
If three consumers all want (layer=14, hook="post_mlp", positions="all_prompt") for the same request, the runtime does one index_select from the pristine residual into a scratch buffer, then tags each row with a consumer_mask: int whose bit i is set iff consumer i wants that row. The dispatch thread fans the chunk out by checking consumer_mask & (1 << i) per consumer. This matters at scale. if you have a filesystem consumer doing wholesale data collection and a driver-side reward consumer running on the same set of layers, you’re not paying two gathers. You’re paying one gather and a couple of int ops.
The filesystem consumer is the most-used one. It bypasses the in-memory batched-adapter shape by implementing CaptureSink directly, and a few details about it are worth pulling out because they generalize to anything wanting durable on-disk capture:
- Hash-partitioned thread pool: Writes are dispatched to
hash(request_id) % num_threads, which preserves append ordering per(request_id, layer, hook)without needing cross-thread locks. - Per-thread LRU FD cache on
.bin.tmpfiles: Steady-state writes don’t reopen the same shard, and the LRU bound keeps FD count from growing with request volume. - Atomic publish via
fsync+os.replace: A crashed engine never leaves a half-written shard visible to readers. - Path layout:
{root}/{tag_slug}/{request_id_slug}/{layer}_{hook}.binplus a.jsonsidecar with the position list and request metadata.
Dispatch path
The capability side of capture (entry-point plugins, worker/driver locations, union gather) is what makes the subsystem usable. The dispatch path is what makes it usable under load, and it was the perf trap.
The original implementation did the H2D copy and consumer fan-out on the main runner thread, with a cuda.synchronize() to make sure the GPU rows were ready before handing them to the consumer. That synced every step in any served mode where capture was on, which was unacceptable. The current path looks like this:
# Main runner thread, post-forward:
side_stream.wait_stream(compute_stream)
with torch.cuda.stream(side_stream):
    pinned = self._lease_pinned_buffer(key, scratch.shape, scratch.dtype)
    pinned.copy_(scratch, non_blocking=True)
    scratch.record_stream(side_stream)  # caching allocator safety
event = torch.cuda.Event()
event.record(side_stream)
self._dispatch_queue.put(_DispatchPacket(key, pinned, event, ...))
# return immediately. no sync, no consumer code on the critical path.

# Dispatch daemon thread:
packet = self._dispatch_queue.get()
packet.event.synchronize()
sink.submit_chunk(CaptureChunk(...))
A dedicated CUDA side stream means PCIe overlaps with the next forward step’s kernels. The pinned buffers are leased from a per-(layer, hook) pool with capacity rounded up to a 16-row boundary, so a request whose row count nudges by one doesn’t trigger a fresh pin_memory allocation. The record_stream call tells the caching allocator that the scratch tensor is still in use on the side stream, preventing the kind of allocator-reuse-during-copy bug that produces silently corrupted data. The dispatch thread is wrapped in try/except around each consumer call.
SAE based steering
The other feature on the wishlist from part 1 was sparse-autoencoder feature clamping, the Golden Gate Claude trick where you decode the residual through an SAE, clamp specific feature activations to chosen values, and decode back. Part 1 covered decoder-direction addition (effectively residual += scale * W_dec[feature]) as a cheap approximation. The real thing requires a full encoder pass plus a per-feature gate plus a decoder pass per token, and is structurally different enough from vector-add steering that it needed its own runtime path. Note that this is currently in feat/sae-steering and hasn’t been benchmarked yet. I want to finish everything I intend to add before doing so.
Two variants of “real” SAE steering:
- Delta form:
residual += decode(modify(encode(residual))) − residual. The model’s residual stream stays mostly intact and gets perturbed only by the clamp deltas, which is the right shape for additive clamps where you want to nudge specific features up or down without ripping the residual apart. - Full reconstruction:
residual = decode(modify(encode(residual))). The residual is entirely replaced by the SAE’s reconstruction, with whatever clamp was specified imposed on the bottleneck features. Lossy by construction since the SAE is not a perfect autoencoder, but it’s the only path that gives you the “fully replace the model’s representation with the SAE’s view of it” semantics that the published Golden Gate behavior used.
The delta path is fully integrated. The full-reconstruction path landed as an eager reference op; the fused kernel, opaque custom-op registration, and worker integration are next on the queue. I’m going to focus on the delta path here because it’s the one that’s fully implemented.
Additive vector steering has a “global” tier (the named-module registry) that lets a single config be shared across many requests at row cost 1. SAE clamps don’t get that. Every request supplies its own clamp spec, and the manager allocates a fresh row keyed by (spec_hash, phase). The reason is that SAE clamps are much more configuration-dense than additive vectors (each spec carries (feature_idx, kind, value, only_if_active) for potentially hundreds of features per layer) which requires more performance work to not slow everything down with global steering since config management ended up being what slowed down the hot path for additive steering. The hash function is the same shape as hash_steering_config but with a sae_clamps domain separator prepended so an additive-vector hash can’t ever collide with a clamp hash by accident.
Otherwise, they work the same as the additive path. They have per-hook flat buffers. Each layer carries kind_table_{hook}, value_table_{hook}, only_table_{hook} as concrete attributes (never wrapped in an nn.Module) so torch.compile traces them as static buffers instead of opaquing through a submodule call. The populator walks manager.active_rows() and writes each spec into the appropriate (layer, hook, row) cell under its assigned row_phase. Row 0 is always the no-op sentinel and is defensively re-zeroed every populate so a stale value can’t bleed into a request that happens to land there. A _tables_dirty flag flipped on every row mutation lets the populator skip work when nothing changed since the last flush, the same pattern that worked for the vector tables.
The fused Triton kernel is where the actual work happens, and it’s structurally different enough from apply_steering that it gets its own file. One program per token, hidden dimension walked in BLOCK_H tiles, clamp dimension staged register-resident in a BLOCK_C-wide tile (next_pow2(n_clamp), capped at 256; falls back to eager beyond, since the clamp set is sparse and 256 is plenty for the real workloads I care about). Both encoder and decoder GEMMs accumulate in fp32 regardless of weight dtype.
for h_off in range(0, H, BLOCK_H):
    h_idx = h_off + tl.arange(0, BLOCK_H)
    mask_h = h_idx < H
    hidden_tile = tl.load(hidden_row_ptr + h_idx * h_stride_h, mask=mask_h)
    enc_tile = tl.load(W_enc_ptr + ...)  # [BLOCK_H, BLOCK_C]
    pre_act += tl.sum(hidden_tile[:, None] * enc_tile, axis=0)
pre_act += b_enc_tile

if ACTIVATION_CODE == ACT_RELU:
    f = tl.maximum(pre_act, 0.0)
elif ACTIVATION_CODE == ACT_JUMPRELU:
    f = tl.where(pre_act > threshold_tile, pre_act, 0.0)
elif ACTIVATION_CODE == ACT_TOPK:
    rank = tl.sum((pre_act[:, None] > pre_act[None, :]).to(tl.int32), axis=1)
    f = tl.where(rank < TOPK_K, pre_act, float("-inf"))
    f = tl.maximum(f, 0.0)

kind = tl.load(kind_ptr + clamp_idx)
value = tl.load(value_ptr + clamp_idx)
only  = tl.load(only_ptr  + clamp_idx).to(tl.int32)
new_f = tl.where(kind == 1, value,
        tl.where(kind == 2, f + value, f))
gate  = (kind != 0) & ((only == 0) | (f > 0.0))
delta = tl.where(gate, new_f - f, 0.0)

for h_off in range(0, H, BLOCK_H):
    ...
    out_tile = hidden_tile + tl.sum(delta[:, None] * dec_tile, axis=1)
    tl.store(out_row_ptr + h_idx * o_stride_h, out_tile, mask=mask_h)
A few details worth pulling out. ACTIVATION_CODE is a tl.constexpr, so Triton compiles a distinct binary per activation function and the dead branches DCE at compile time rather than at runtime. The kernel size on hot paths stays small. only (the “only clamp if this feature is currently active” gate) is a bool tensor reinterpreted via .view(torch.int8) so the kernel can load it as a regular int instead of going through the bool-load slow path. The output is always a fresh tensor, never in-place, so torch.compile keeps value semantics intact and Inductor can reason about it as a pure function. And the public op is wired into the direct_register_custom_op flow with a primitive-typed schema (activation_code: int, activation_param: float) because torch.library.infer_schema doesn’t accept Python enums.
JIT needs to be prewarmed to avoid first request lag, same as the vector kernel. First-call JIT for the SAE kernel landed at ~30 ms inside a served request when I first turned it on. warmup_apply_sae_delta_kernel does a 1-token launch ahead of CUDA-graph capture so the JIT bill is paid in the prep window, and the served window stays clean.
Two loader formats are supported. The generic one is a manifest.json + one layer_<idx>_<hook>.safetensors per site with row-aligned encoder_weight, encoder_bias, decoder_weight. The Gemma Scope one (load_gemma_scope_sae) reads params.npz directly (full W_enc, W_dec, b_enc, threshold, b_dec), subsets to the clampable_features list (you usually don’t want to clamp on every feature in a 16k-feature SAE), and defaults the scalar JumpReLU threshold to the median of the clampable subset, which is overridable per request. merge_loaded_sae_modules unions per-site loads into a single named module after verifying d_model, d_sae, activation, and clampable_features all agree across sites. I validated the delta path against google/gemma-scope-2b-pt-res and confirmed the clamp values produce the published behavior shifts at the published feature indices.
After this the natural next step is cross-layer transcoders, which share enough infrastructure with the SAE work (per-feature clamp logic, the encoder/decoder GEMM shape, the loader contract) that it should be a less invasive add than the SAE work was.
What’s next
- Tying activation capture back into the steering registry (capture writing a feature similarity into the steering path so vectors can be modulated by what the residual is currently doing) is the next thing on the list. This was the dynamic-steering wish list from part 1 that needed both the capture plugin system and the strict-capacity steering runtime to exist first; both are now there
- Fused kernel and custom op for the full reconstruction path on SAE steering and a full profiling + optimization pass which will enable performant global steering
- Steering using transcoders instead of SAEs
- Steering and activation capture for mHC based models like Deepseek V4
As always, if you want to talk to me about any of this or have ideas that would help your own research please reach out to me on X at @RhizoNymph